When too many colours are not good!
Sometimes there are too many groups along the X-axis and mapping colours to them is not desired. The SingleColour argument in plot_ and plot_3d_ functions allows plotting two variables where the colour along X variable remains the same.
A colour can be chosen for the SingleColour argument in three ways:
- using any hexcode (most flexible way; recommended)
- name or hexcode of a
grafifycolour (can be looked up easily. - any number from 1-154 (the list of all colours in
grafify- not recommended)
See the grafify colour palettes on how to get grafify hexcodes and names.
Note: Between versions 1.5 - 2.2 of grafify, seven separate plot_ functions whose names ended in _sc (for single colour or same colour) provided this feature. They’ve been deprecated to reduce the number of different functions, and this feature retained with SingleColour argument in existing functions.
Data format
See the data help page and ensure data table is in the long-format.
Saving graphs
See Saving graphs for tips on how to save plots for making figures.
Single colour graphs
Only some examples are shown to make the point. All plot_... functions for two-variables operate similarly with respect to the SingleColour argument.
plot_scatterbar_sd & plot_dotbar_sd
In both cases, the colour of the categorical X variable is passed on to the colour argument.
#avoid this
plot_scatterbar_sd(data = data_doubling_time,   #data table
                   xcol = Student,           #X variable
                   ycol = Doubling_time)+    #Y variable
  labs(title = "Scatter bar/SD - too many colours!", #title
       subtitle = "(default `okabe_ito` palette)")       #subtitle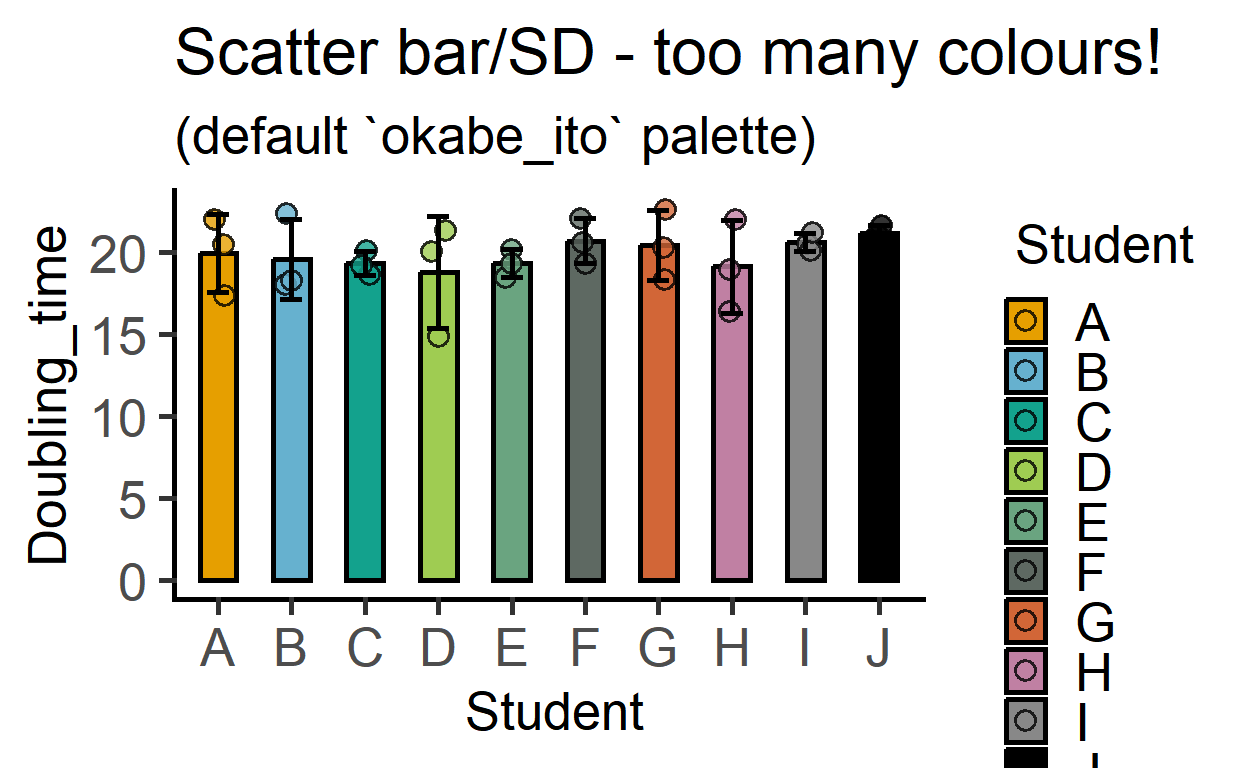
#use single-colour variant
plot_scatterbar_sd(data = data_doubling_time,#data table
                   xcol = Student,           #X variable
                   ycol = Doubling_time,     #Y variable
                   SingleColour = "ok_orange")+ #from okabe_ito palette
  labs(title = "Scatter bar/SD & single colour", #title
       subtitle = "(`ok_orange` colour along X)")       #subtitle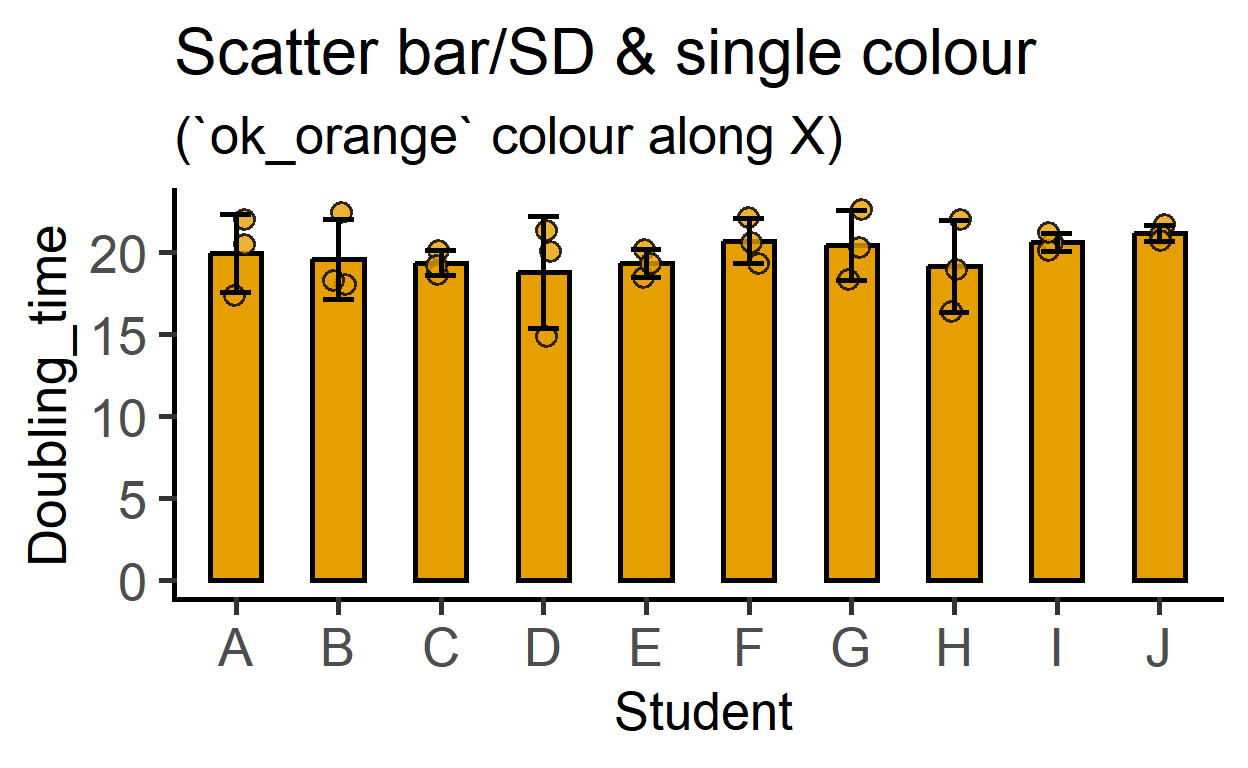
plot_dotbar_sd
Example with a different plot function.
plot_dotbox(data = data_doubling_time,#data table
            xcol = Student,           #X variable
            ycol = Doubling_time,     #Y variable
            SingleColour = "pale_cyan")+ #bright_yellow colour
  labs(title = "Dot box & single colour", #title
       subtitle = "(`pale_cyan` colour)")       #subtitle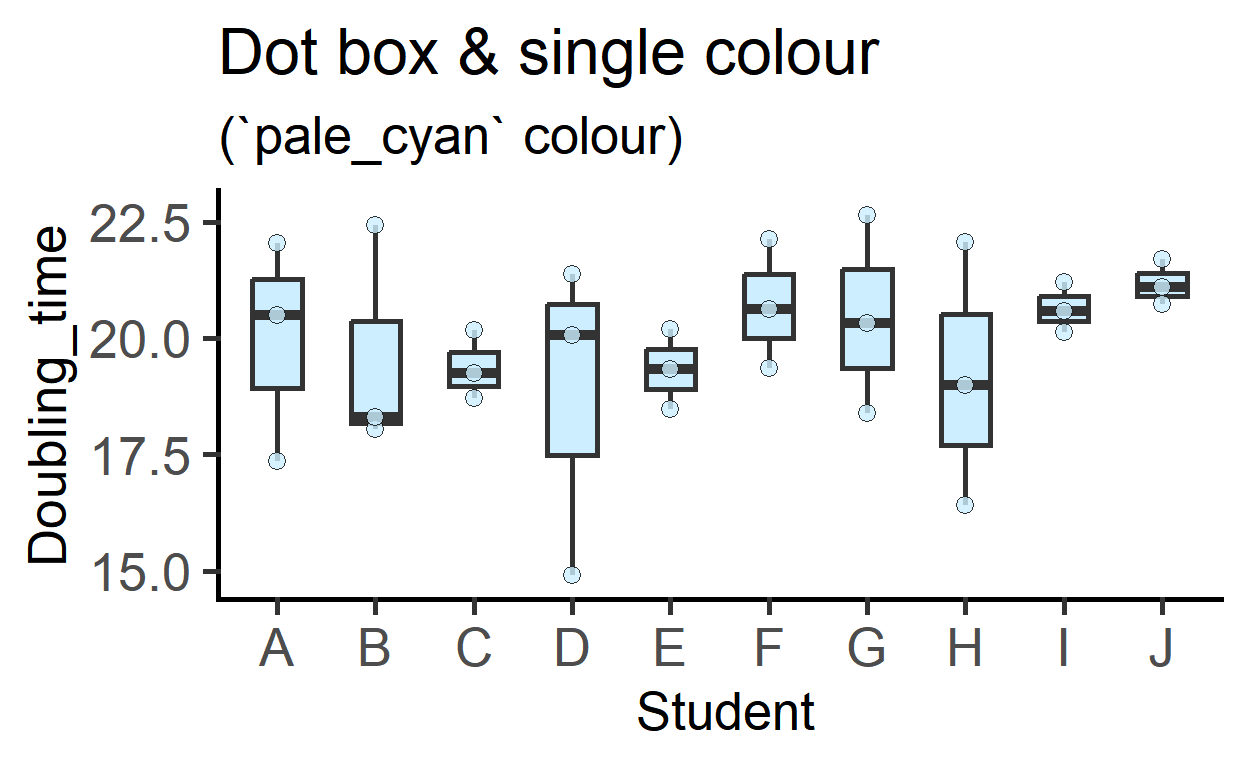
Choose any hexcode
The SingleColour argument accepts any allowed hexcode.
plot_dotbox(data = data_doubling_time,#data table
            xcol = Student,           #X variable
            ycol = Doubling_time,     #Y variable
            SingleColour = "#bcbc01")+ #bright_yellow colour
  labs(title = "Dot box & single colour", #title
       subtitle = "(`#bcbc01` hexcode)")       #subtitle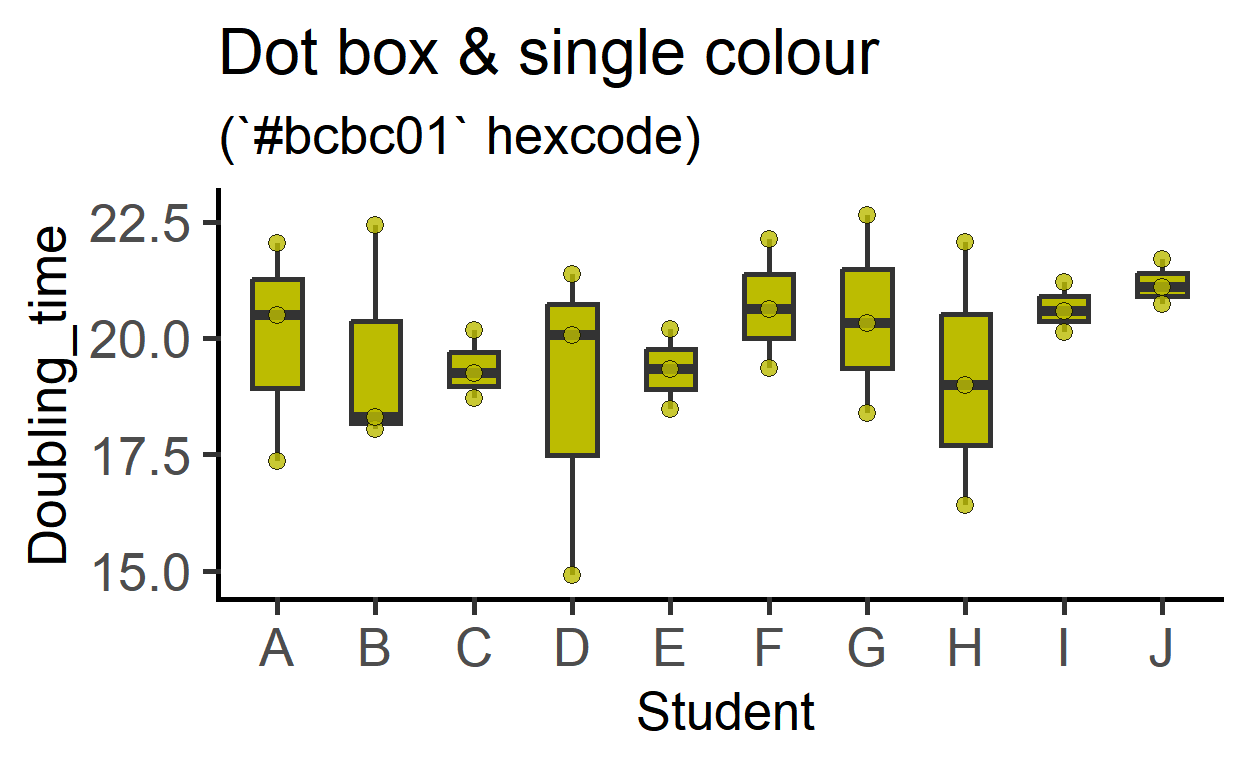
plot_befafter_ in single colour
#single colour with before-after colours
plot_befafter_colours(data_t_pdiff,
                      Condition,
                      Mass,
                      Subject,
                      Boxplot = TRUE,
                      SingleColour = "ok_orange")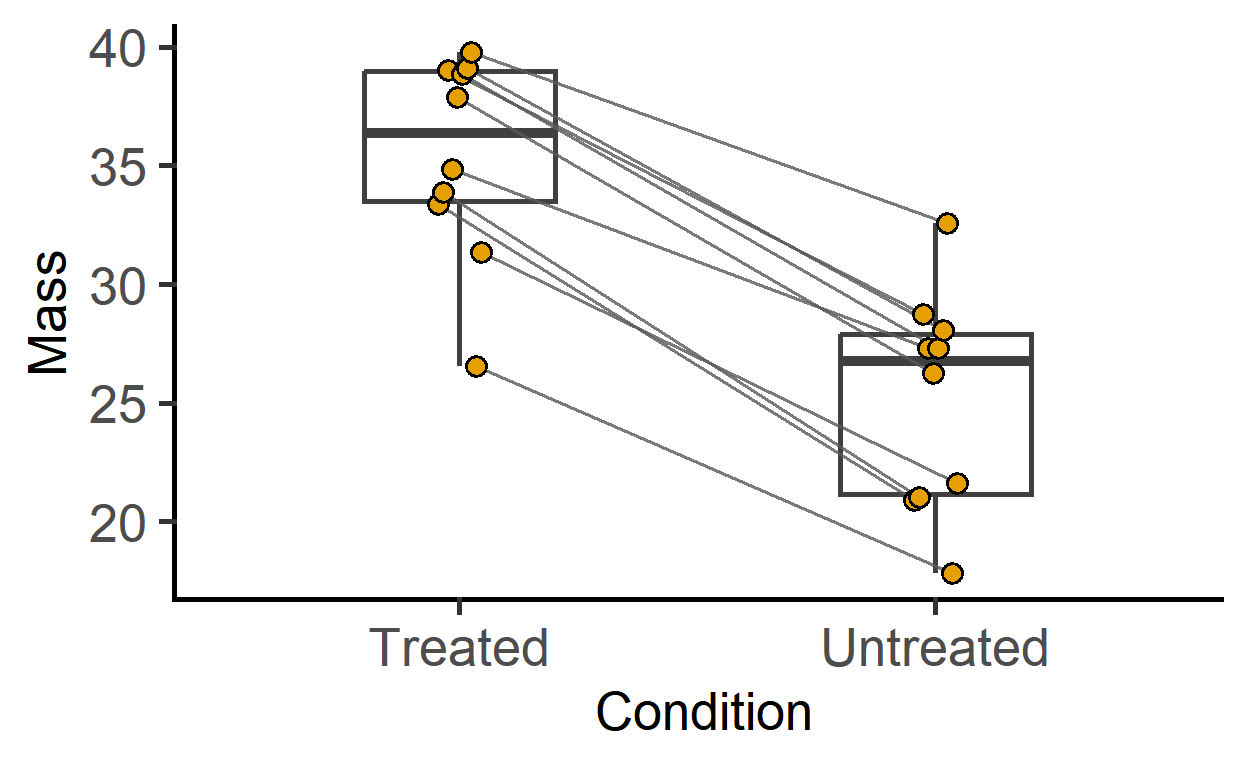
#single colour with before-after shapes
plot_befafter_shapes(data_t_pdiff,
                     Condition,
                     Mass,
                     Subject,
                     Boxplot = TRUE,
                     SingleColour = "ok_bluegreen")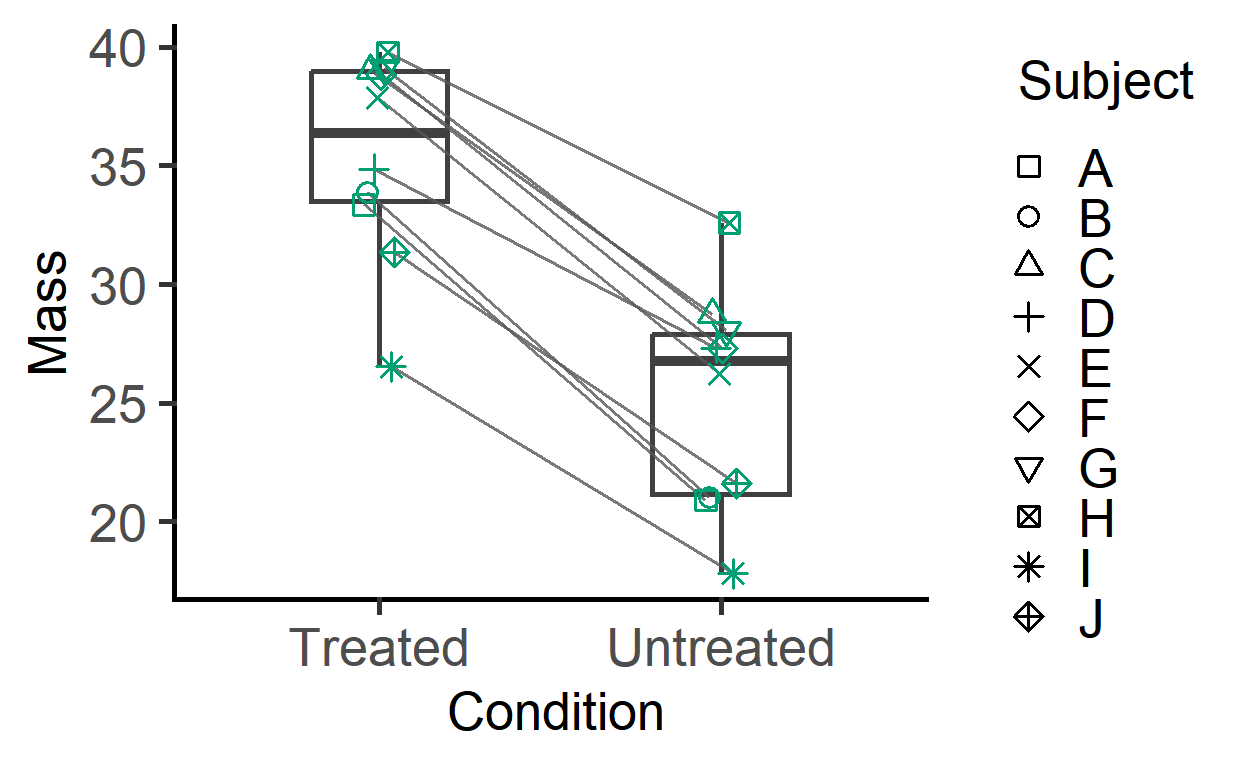
#single colour boxplot with matched symbols
plot_befafter_box(data_t_pdiff,
                  Condition,
                  Mass,
                  Subject,
                  SingleColour = "ok_bluegreen")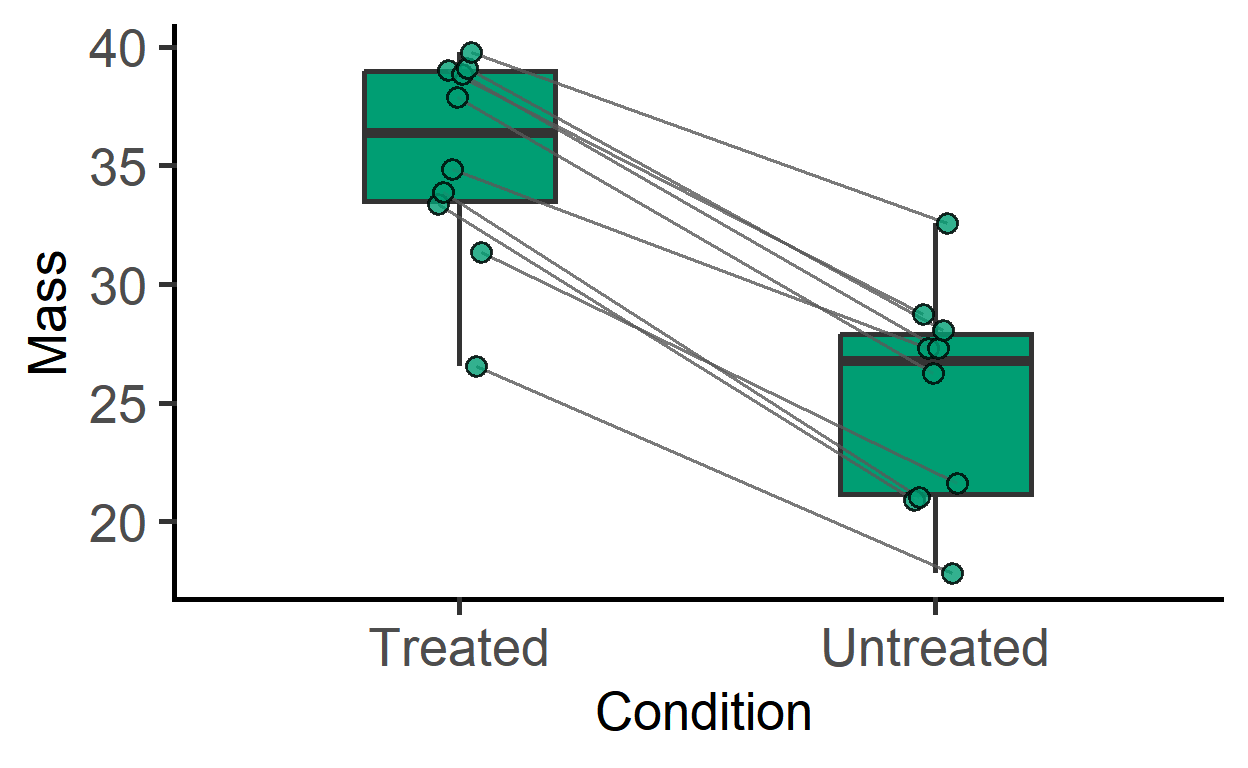
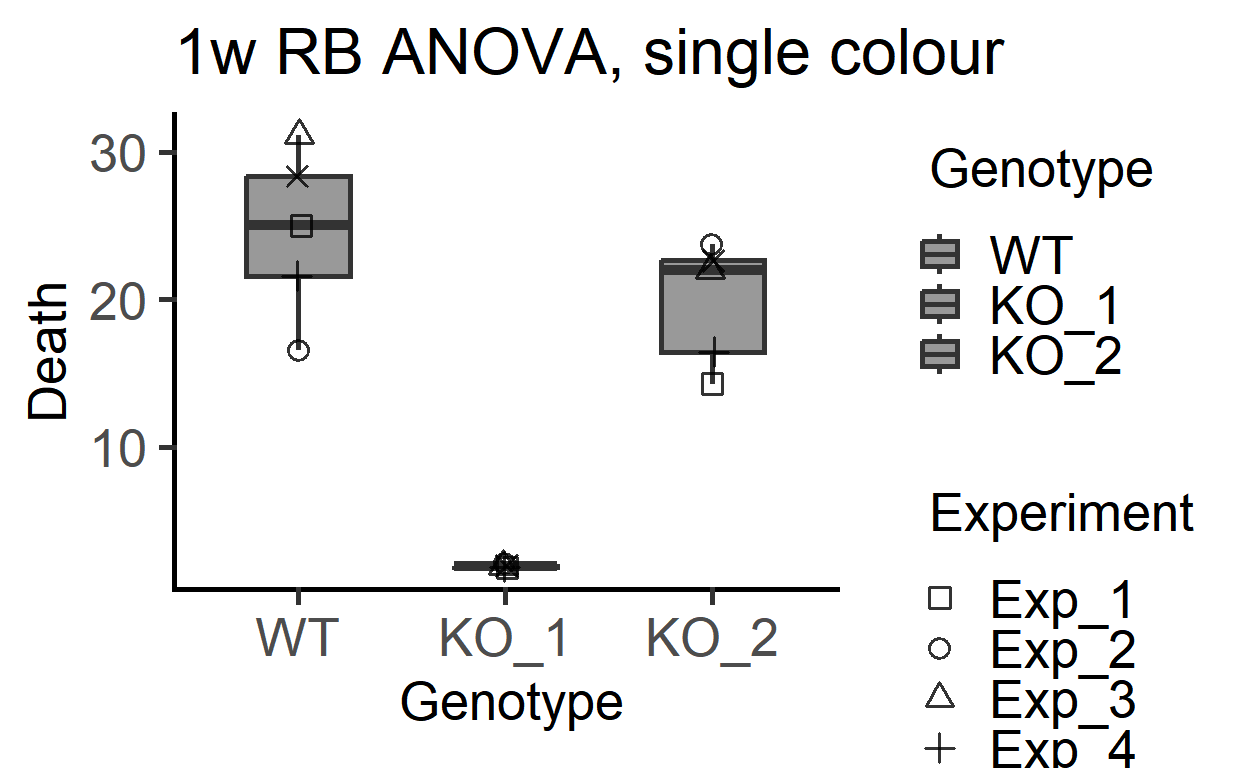
plot_3d_ in single colour
plot_3d_scatterbox(data_1w_death, #data table
                   Genotype,      #X variable
                   Death,         #Y variable
                   Experiment,    #shape variable
                   SingleColour =    graf_palettes$muted[3])+ #colour
  labs(title = "1w RB ANOVA, single colour")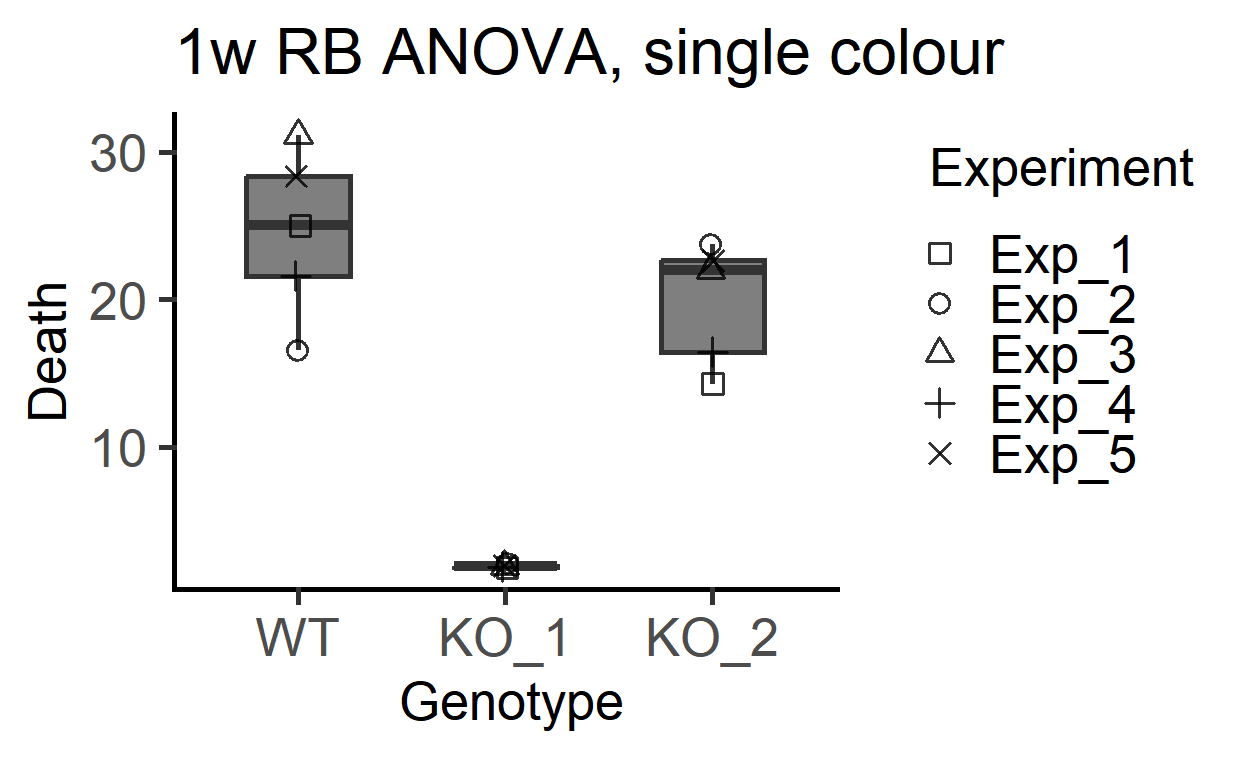
plot_3d_scatterbox(data_1w_death, #data table
                   Genotype,      #X variable
                   Death,         #Y variable
                   Experiment,    #shape variable
                   SingleColour = "ok_grey")+ #colour
  labs(title = "1w RB ANOVA, single colour")