Refer to data format before plotting.
Saving graphs
See Saving graphs for tips on how to save plots for making figures.
plot_xy_NumGroup: three numeric variables
This example uses “mtcars” dataset to plot mileage per gallon (mpg) vs displacement (disp) grouped by number of gears (also a numeric variable) or carburettors (carb; numeric variable). The continuous colour scheme is applied by default (can be changed by any other colour scheme, such as colorbrewer or viridis if required).
plot_xy_NumGroup(mtcars,
xcol = mpg, #numeric X
ycol = disp, #numeric Y
NumGroup = gear, #3rd numeric variable
symsize = 3)+
labs(title = "3 numeric variables",
subtitle = "(blue_conti palette)") #applied by default
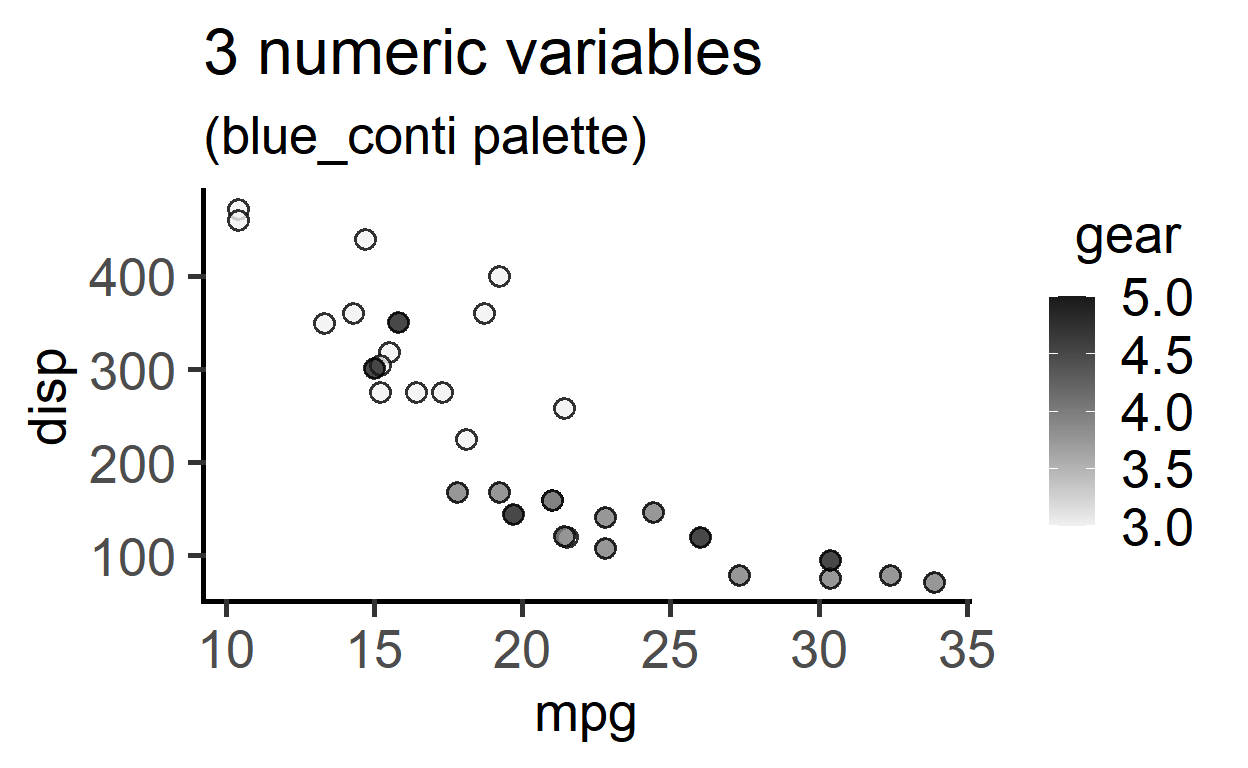
plot_xy_NumGroup(mtcars,
xcol = mpg, #numeric X
ycol = disp, #numeric Y
NumGroup = gear, #3rd numeric variable
ColPal = "grey_conti", #greyscale
symsize = 3)+
labs(title = "3 numeric variables",
subtitle = "(blue_conti palette)") #applied by default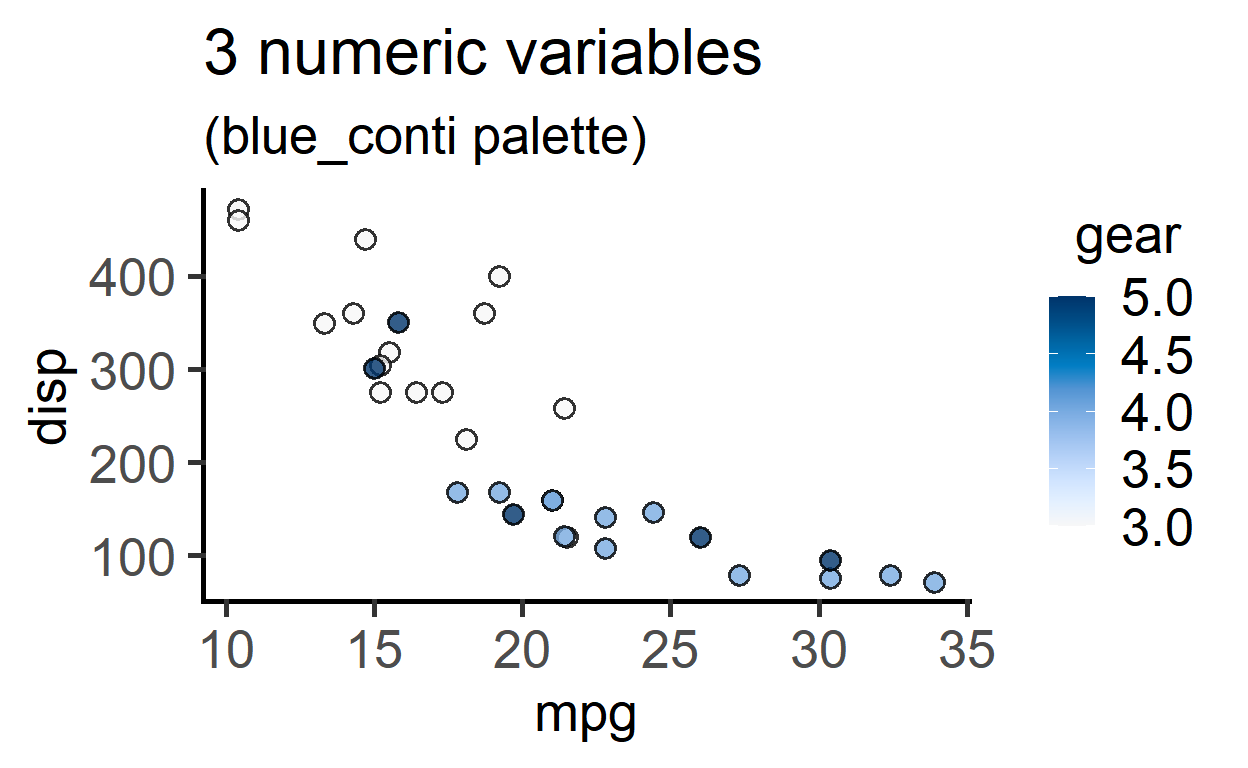
This next example uses the “trees” data set.
plot_xy_NumGroup(trees,
                 Height,
                 Volume,
                 Girth,
                 ColPal = "yellow_conti",
                 symsize = 4,
                 s_alpha = .8)+
  labs(title = "3 numeric variables",
       subtitle = "(yellow_conti palette)")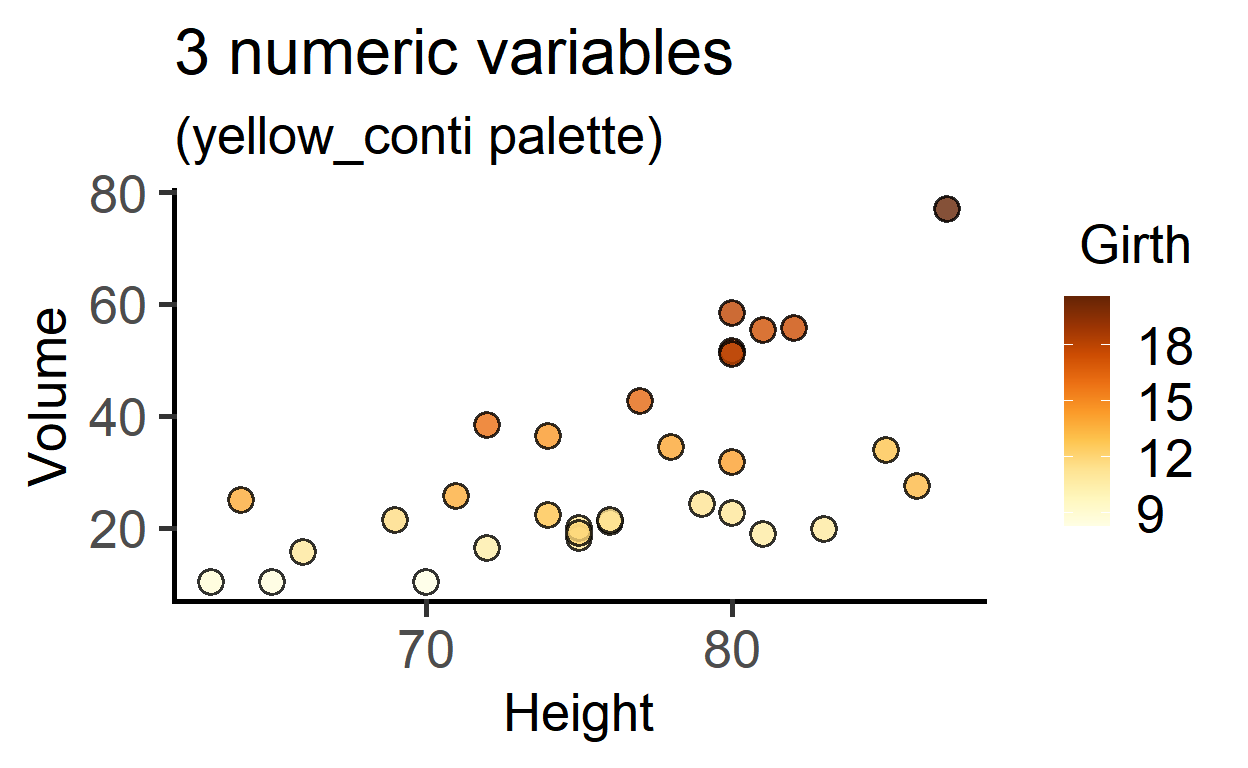
Divergent colour scheme, with data from the diamonds dataset
plot_xy_NumGroup(dplyr::filter(diamonds, cut == "Premium" & clarity == "SI1"),
                 depth,
                 price,
                 carat,
                 s_alpha = .5,
                 ColPal = "PrGn_div")+ #colschem
  labs(title = "`PrGn_div` colour palette")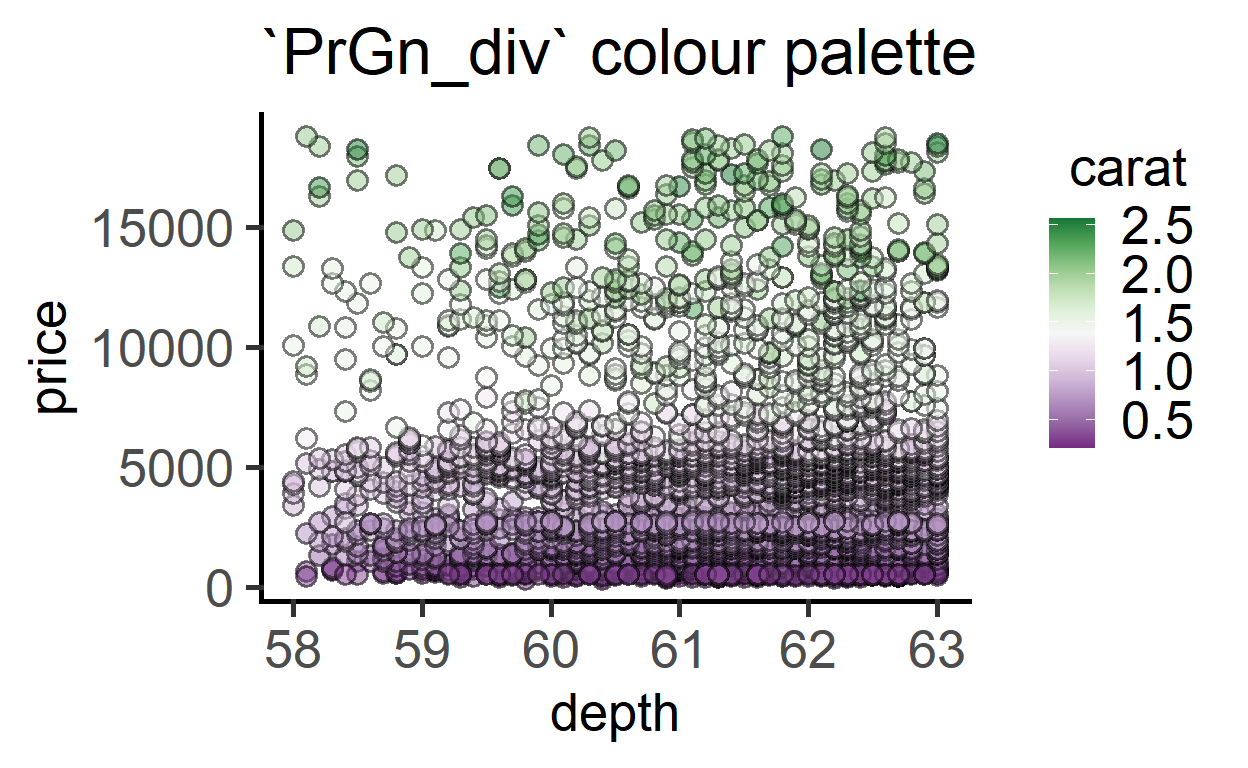
plot_xy_CatGroup: two numeric & one categorical variable
This example uses “neuralgia” dataset from the emmeans package. Age and Duration of pain are numeric variables, Treatment, Sex and Pain are categorical.
head(neuralgia, n = 5) #see the dataset#> Treatment Sex Age Duration Pain
#> 1 P F 68 1 No
#> 2 B M 74 16 No
#> 3 P F 67 30 No
#> 4 P M 66 26 Yes
#> 5 B M 70 22 NoI plot this data with Pain as the grouping factor.
plot_xy_CatGroup(neuralgia,
                 Age,
                 Duration,
                 Pain,
                 symsize = 3,
                 ColPal = "muted",     #palette
                 ColRev = T)+         #reverse colours
  labs(title = "2 numeric & 1 categorical variable",
       subtitle = "(reverse 'muted' palette)")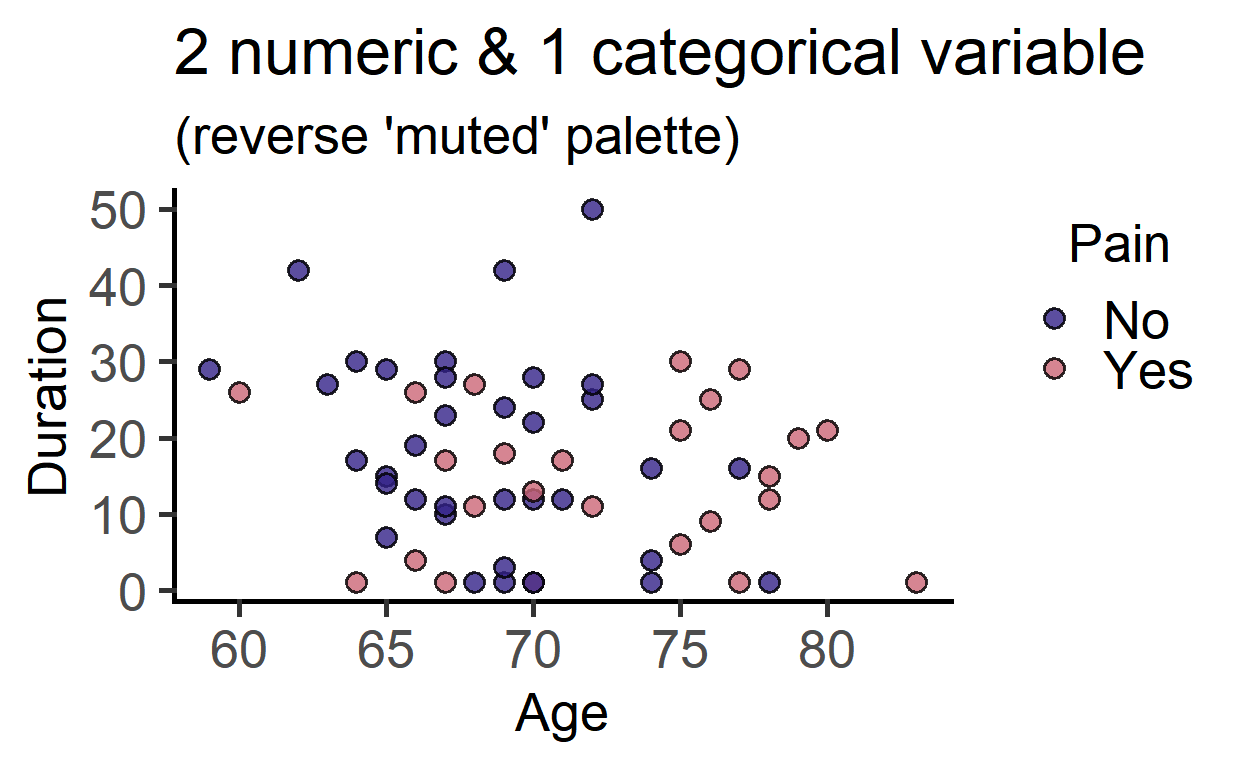
Same data with faceting to include a 4th factor “Treatment”.
plot_xy_CatGroup(neuralgia,
                 Age,
                 Duration,
                 Pain,
                 Treatment,           #facet
                 symsize = 3,
                 ColPal = "vibrant")+ #palette
  labs(title = "2 numeric & 1 categorical variable",
       subtitle = "(reverse 'vibrant' palette, facet_wrap)")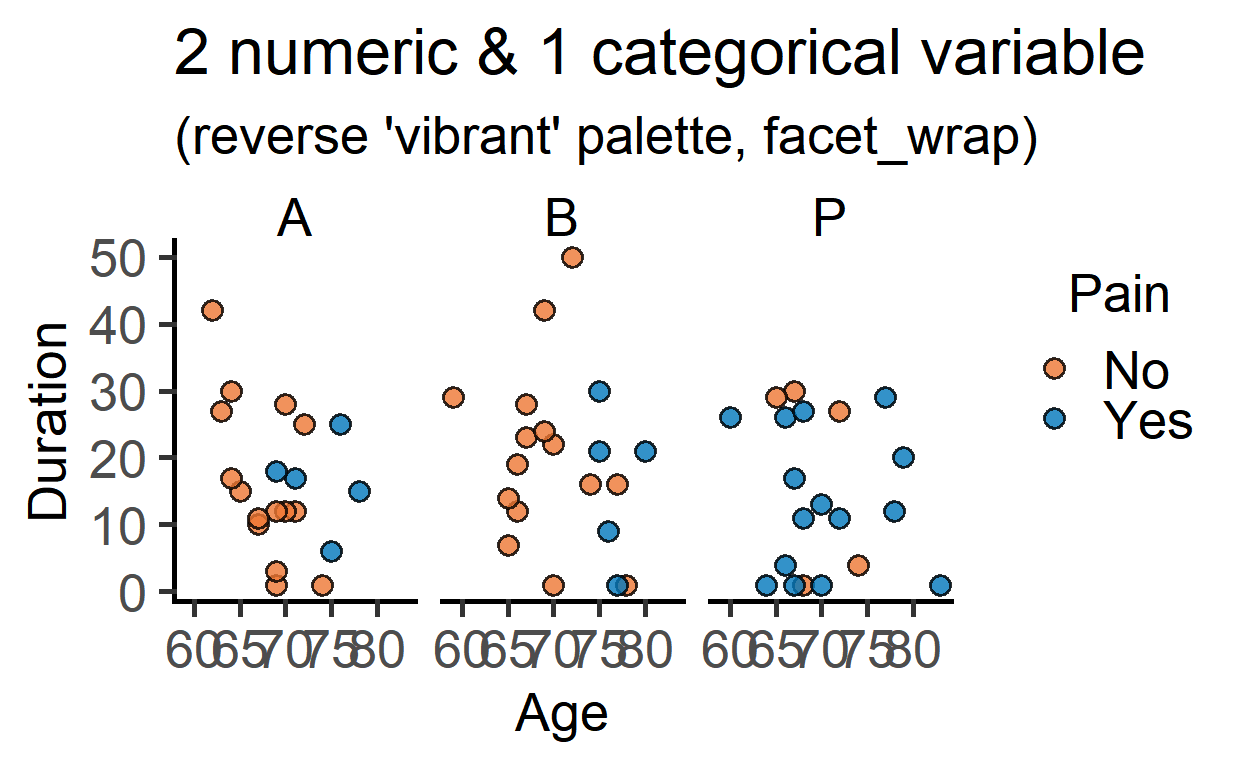
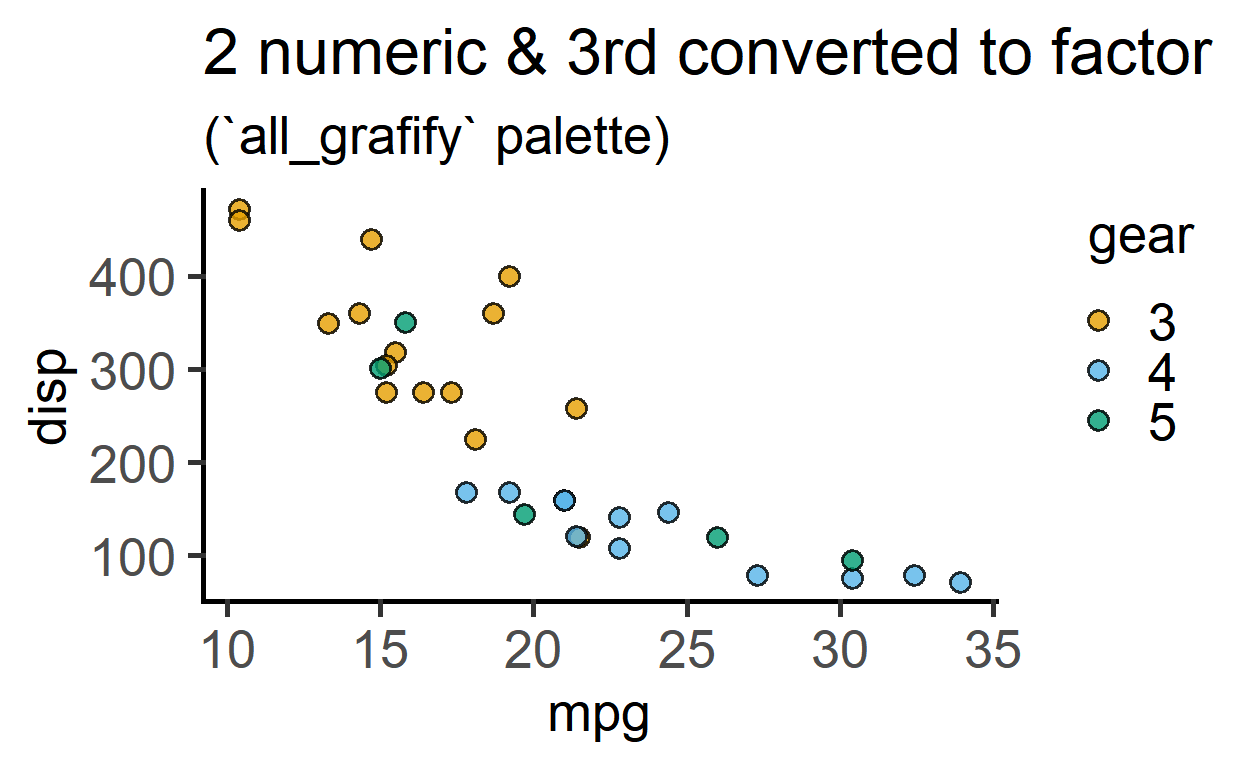
The next example uses the same “mtcars” dataset where gear is automatically converted to a categorical variable (even though it is a quantitative variable in the data table) when plot_xy_CatGroup is used. Compare this to the graph above with plot_xy_NumGroup.
plot_xy_CatGroup(mtcars,
                 xcol = mpg,          #numeric X
                 ycol = disp,         #numeric Y
                 CatGroup = gear,     #3rd variable
                 symsize = 3)+
  labs(title = "2 numeric & 3rd converted to factor",
       subtitle = "(`all_grafify` palette)") #applied by default