Graph gallery v3.2.0 or higher
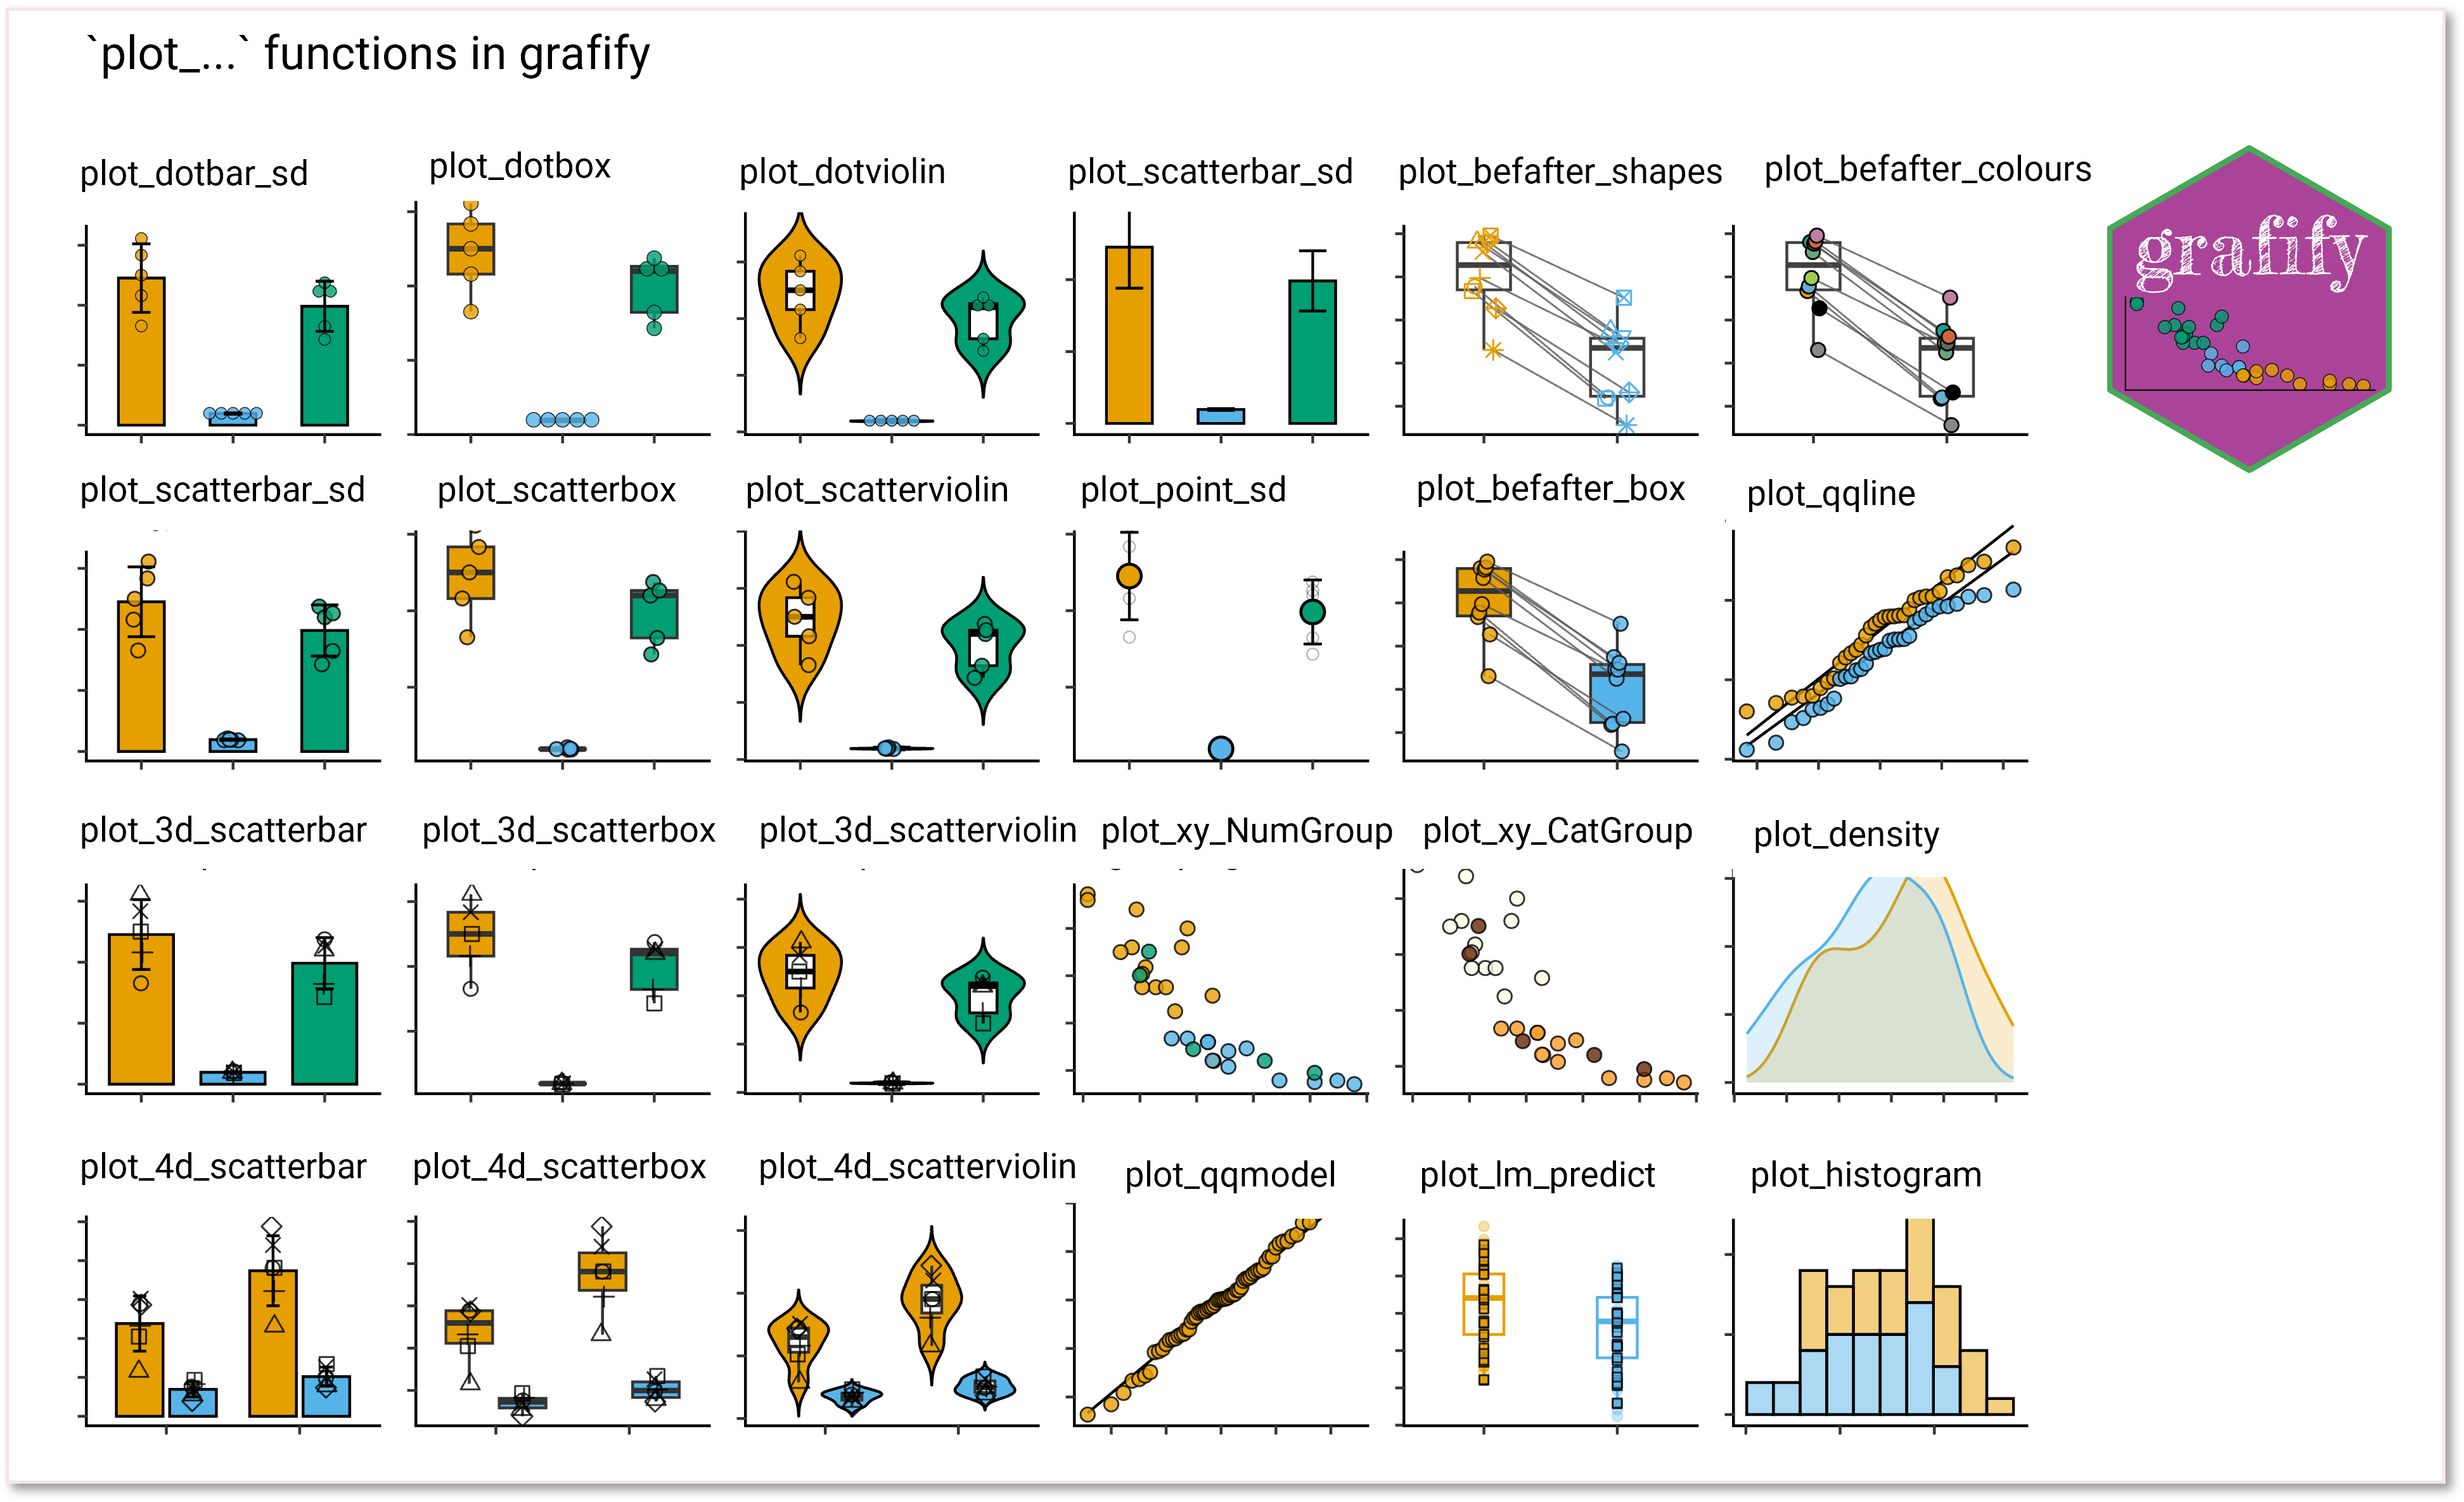
- There are 19
plot_functions of 6 broad types ingrafify.
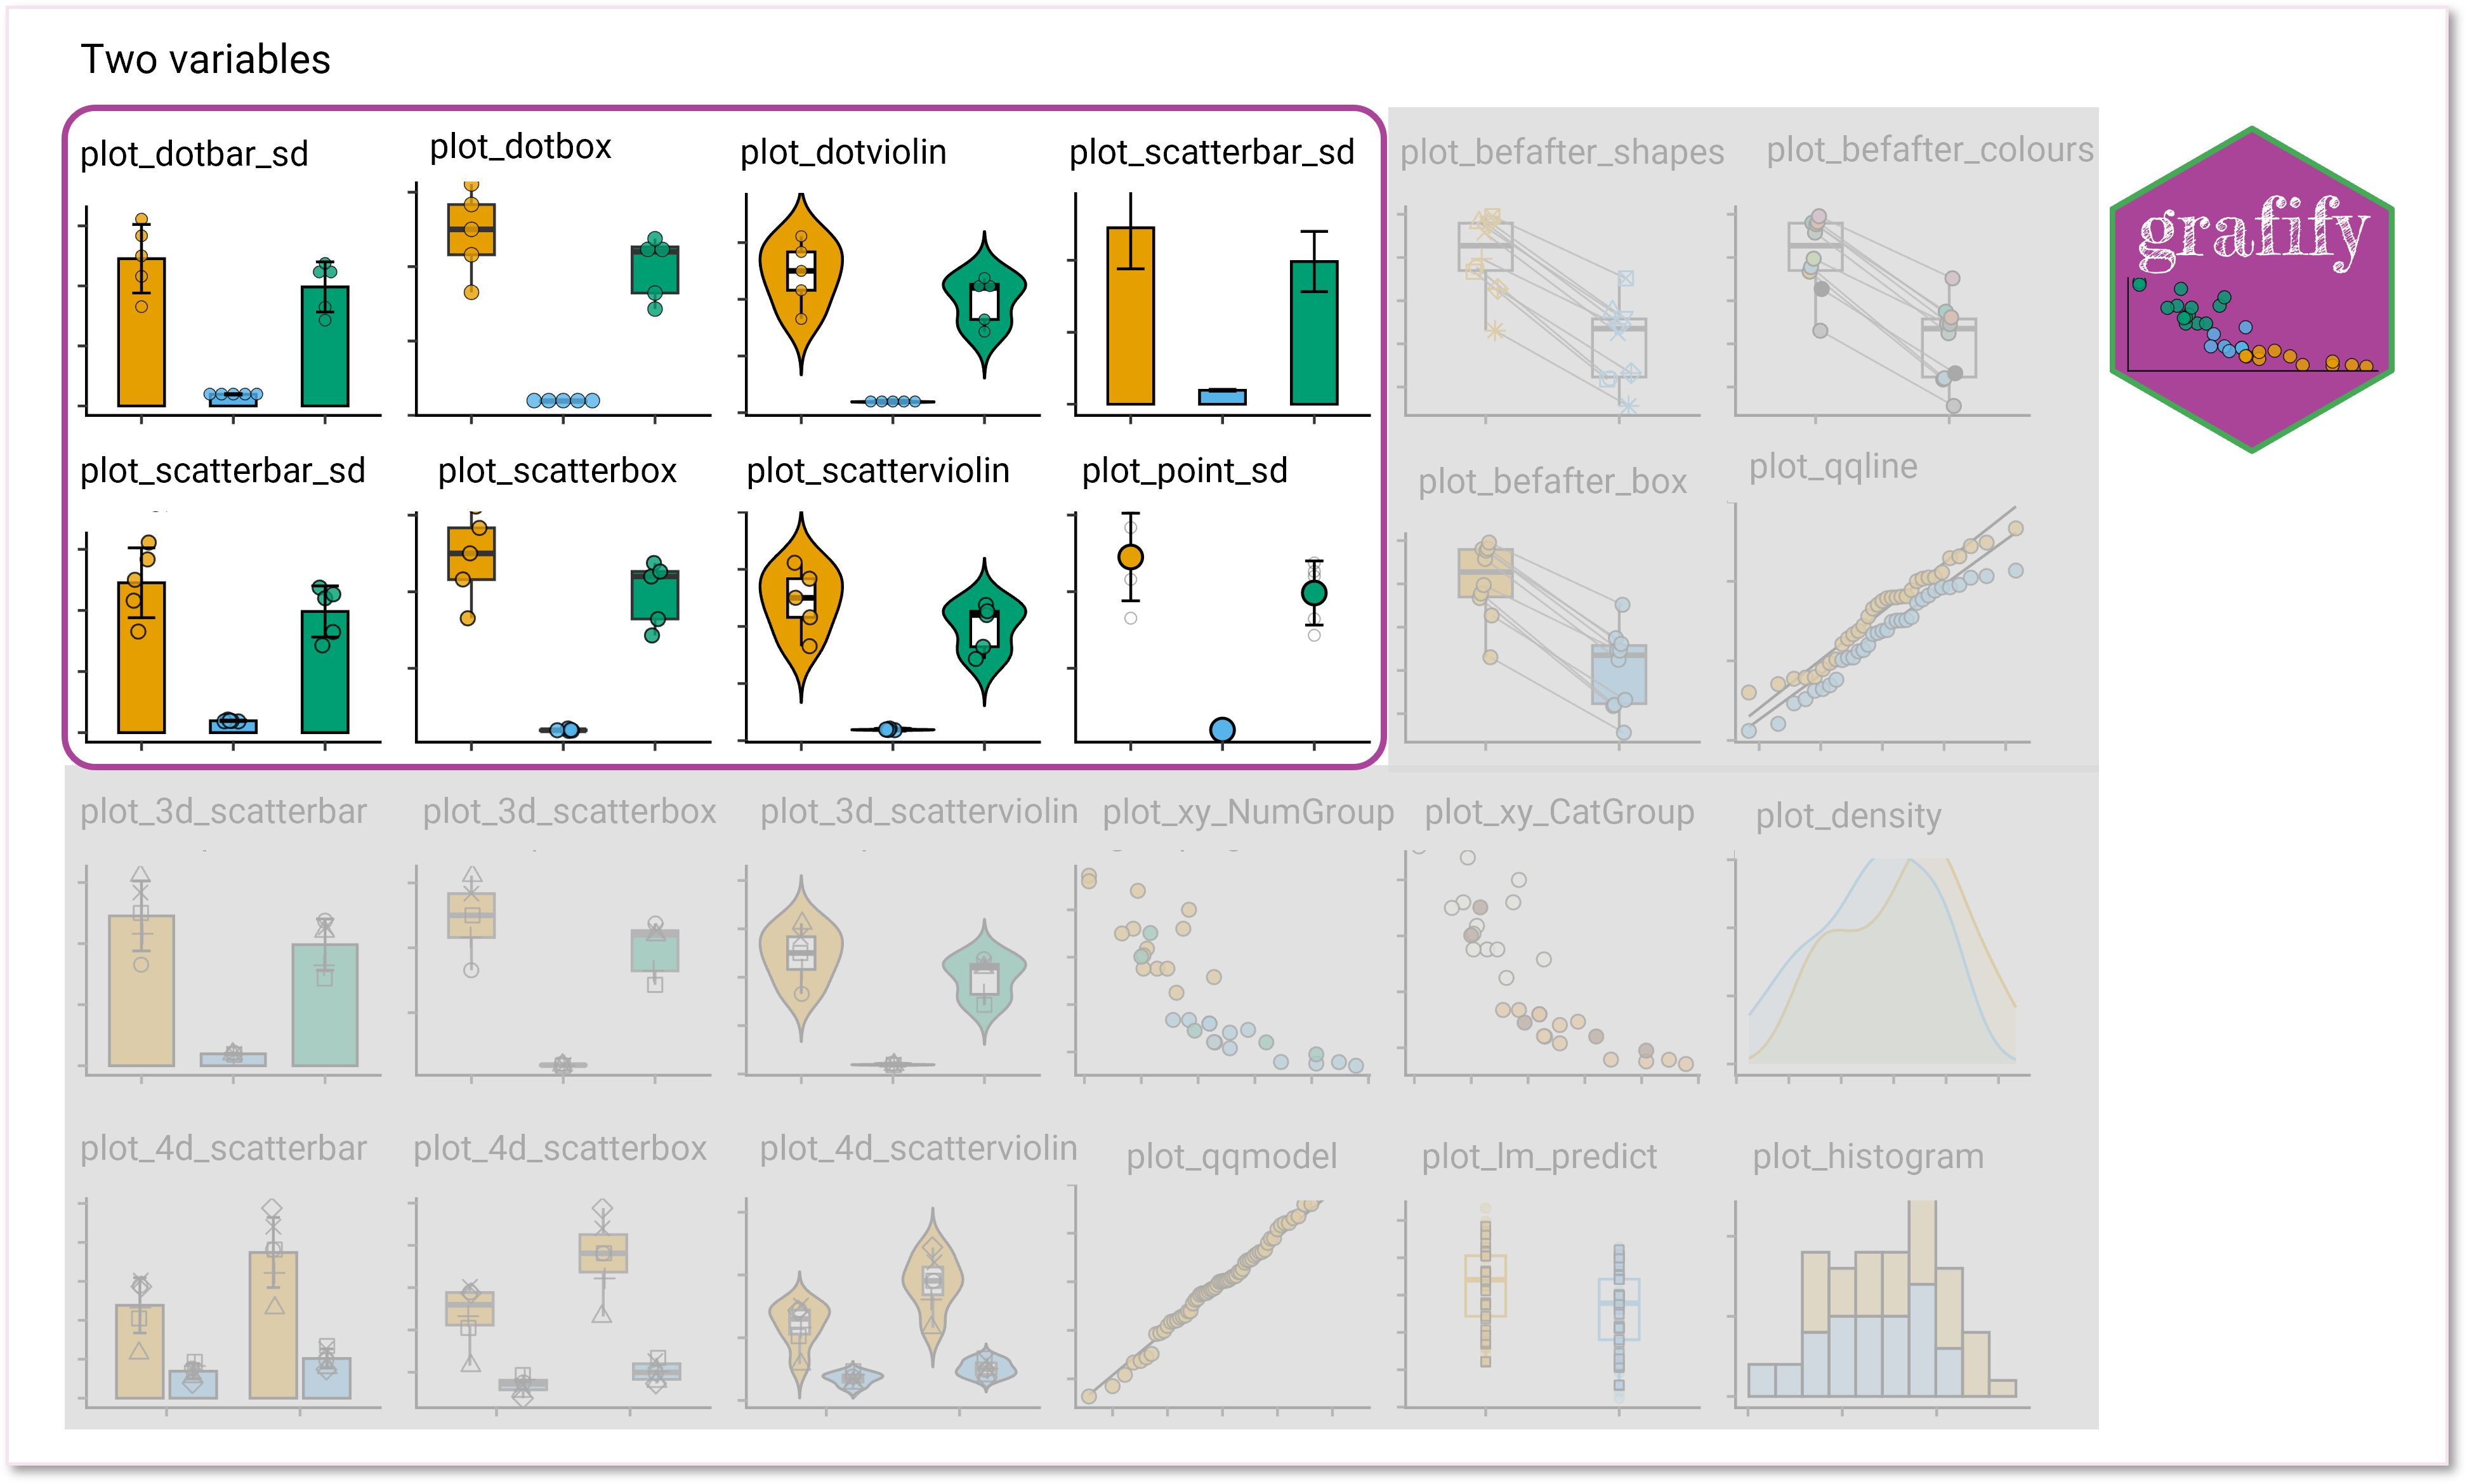
- Two variables: categorical X and numeric Y
bar graphs: as scatter (also called jitter) or dot plots. The
plot_scatter...versions are preferred when there are many data points,plot_dot...versions have a “cleaner” layout for smaller datasets:plot_scatterbar_sd,plot_dotbar_sd,plot_bar_sd,plot_point_sdbox and whiskers plots:
plot_scatterbox,plot_dotboxviolin & box-whiskers plots:
plot_scatterviolin,plot_dotviolin
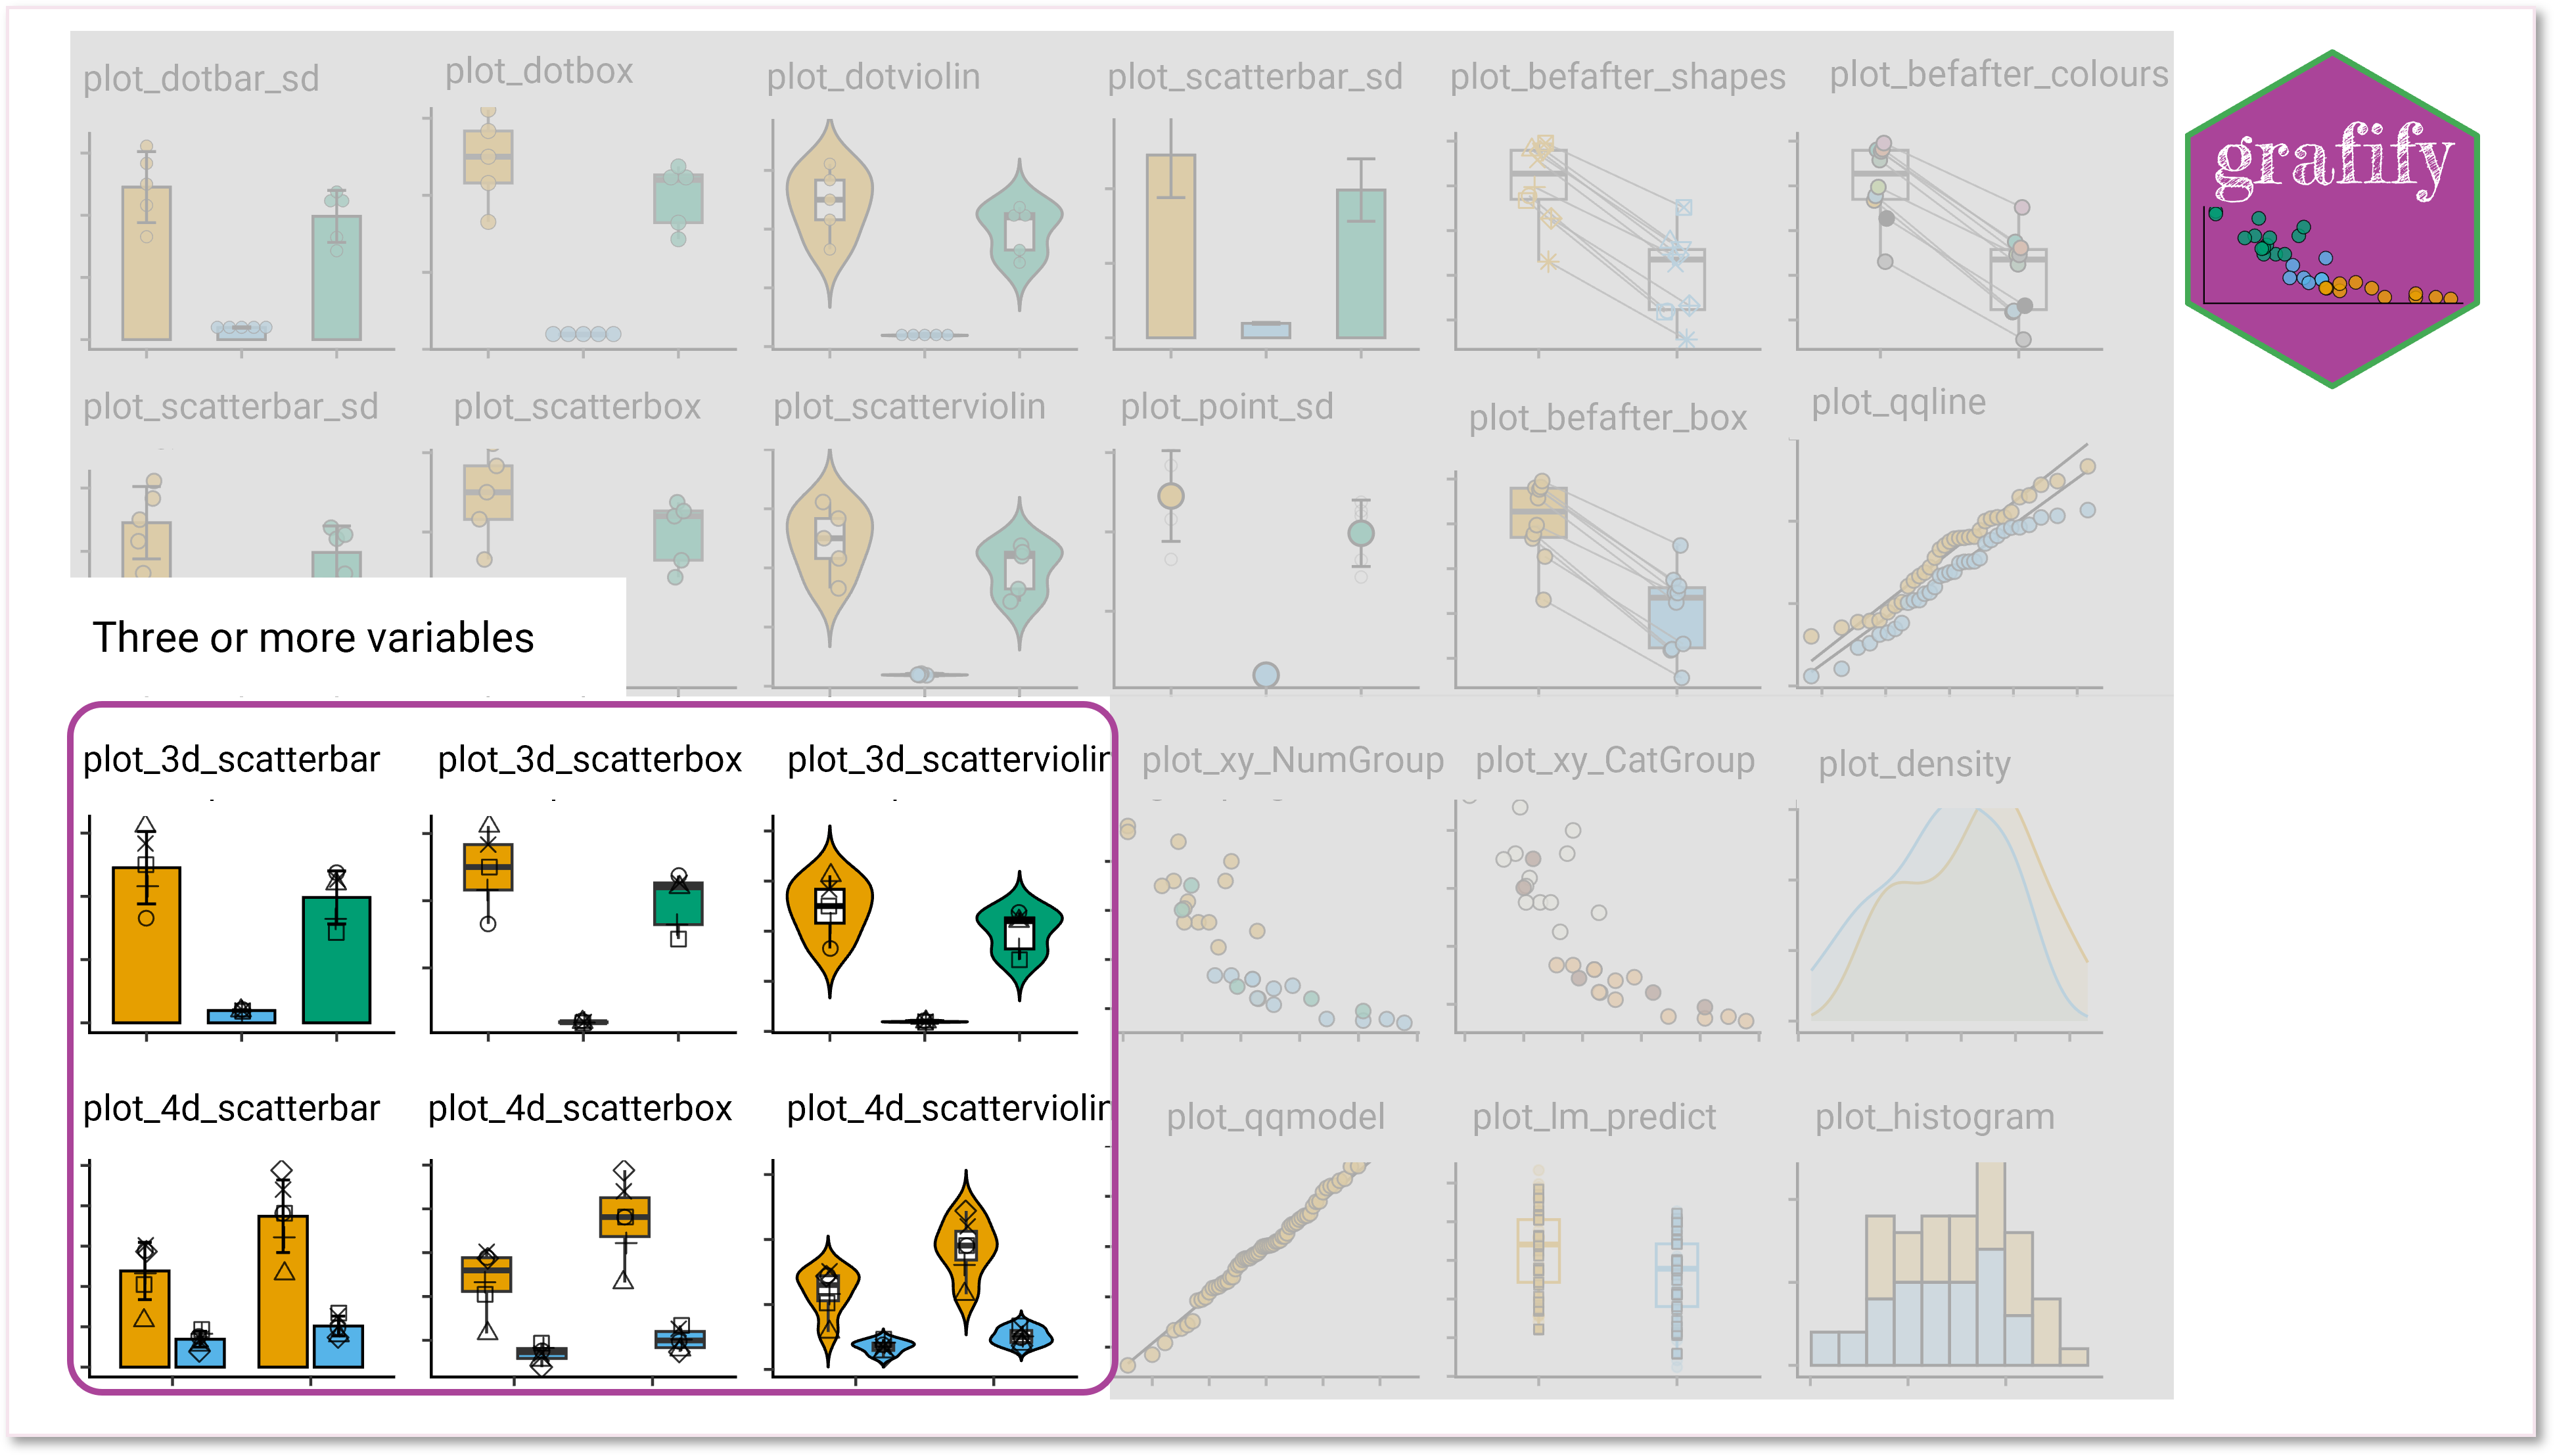
- Three or four variables: With either one (
plot_3d...) or two (plot_4d_...) categorical X and a numeric Y variable.
- bar graphs:
plot_3d_scatterbar,plot_4d_scatterbar - box and whiskers plots:
plot_3d_scatterbox,plot_4d_scatterbox - violin & box-whiskers plots:
plot_3d_scatterviolin,plot_4d_scatterviolin
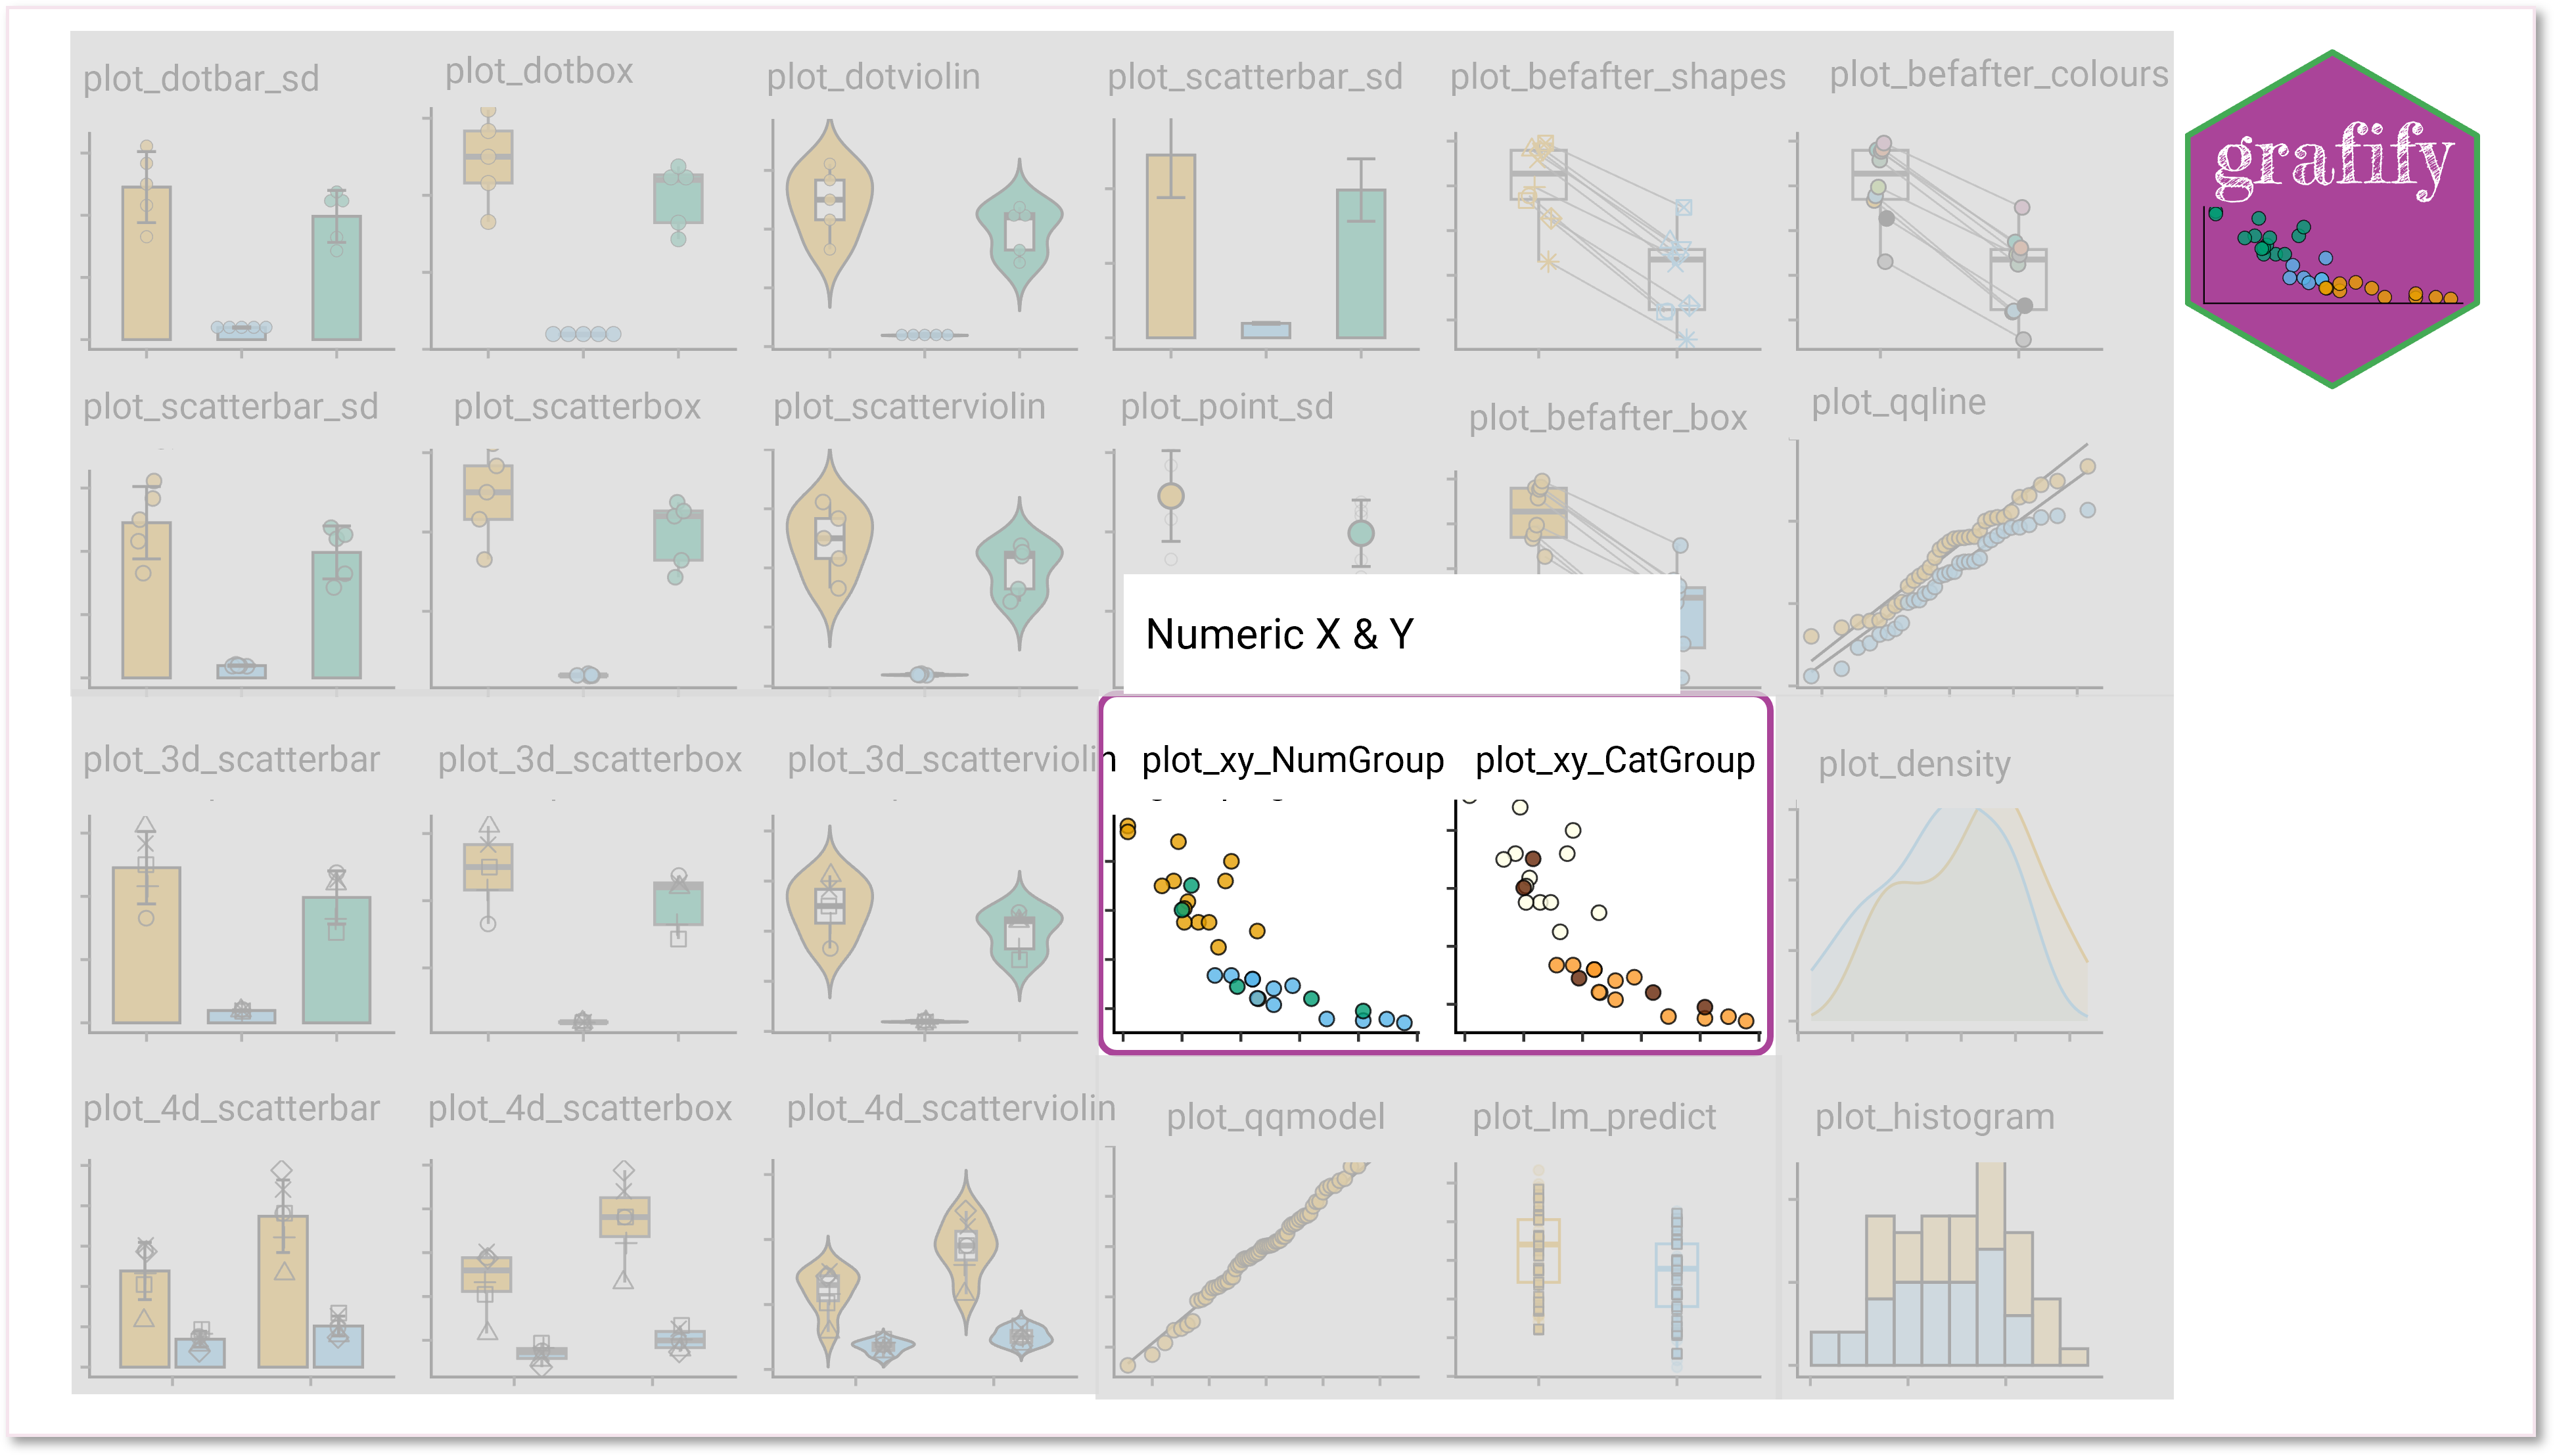
- Quantitative X-Y & a third variable:
plot_xy_NumGroup,plot_xy_CatGroup(new since v0.2.0)
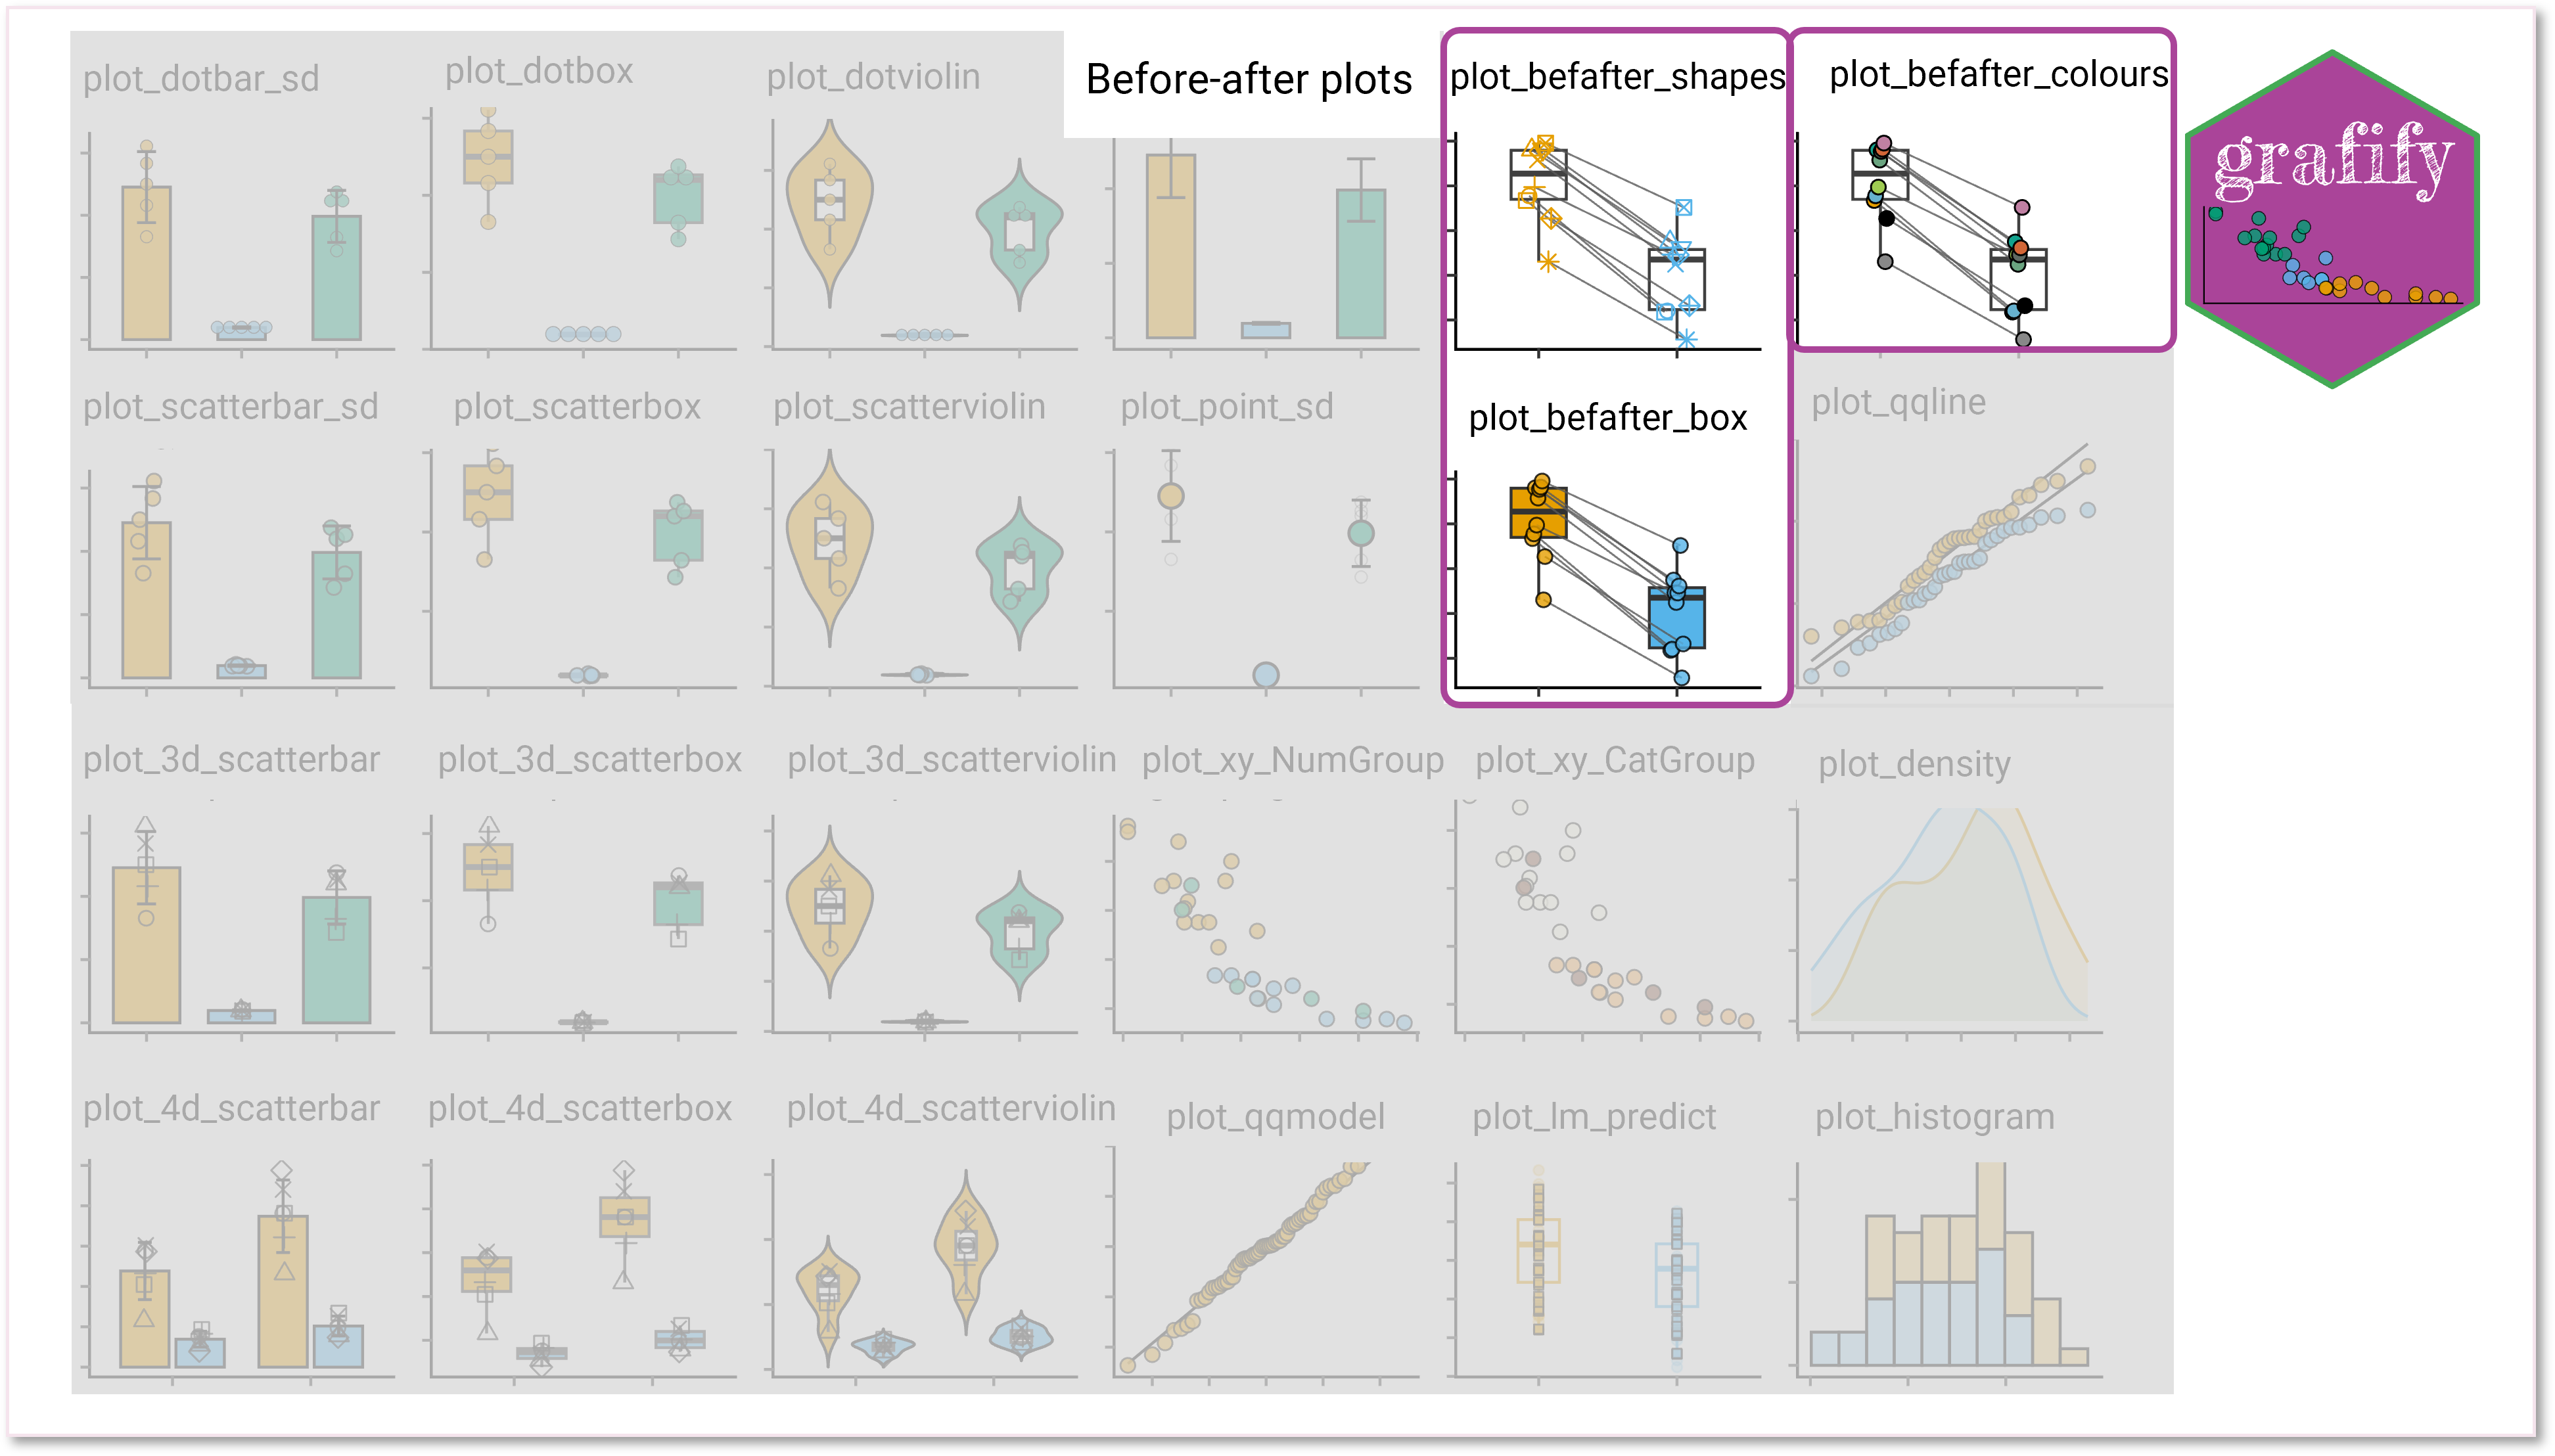
- Matched before-after graphs:
These are useful for depicting changes in matched data (e.g. matched subjects, randomised blocks etc.)
plot_befafter_colours(orplot_befafter_colors)plot_befafter_shapes
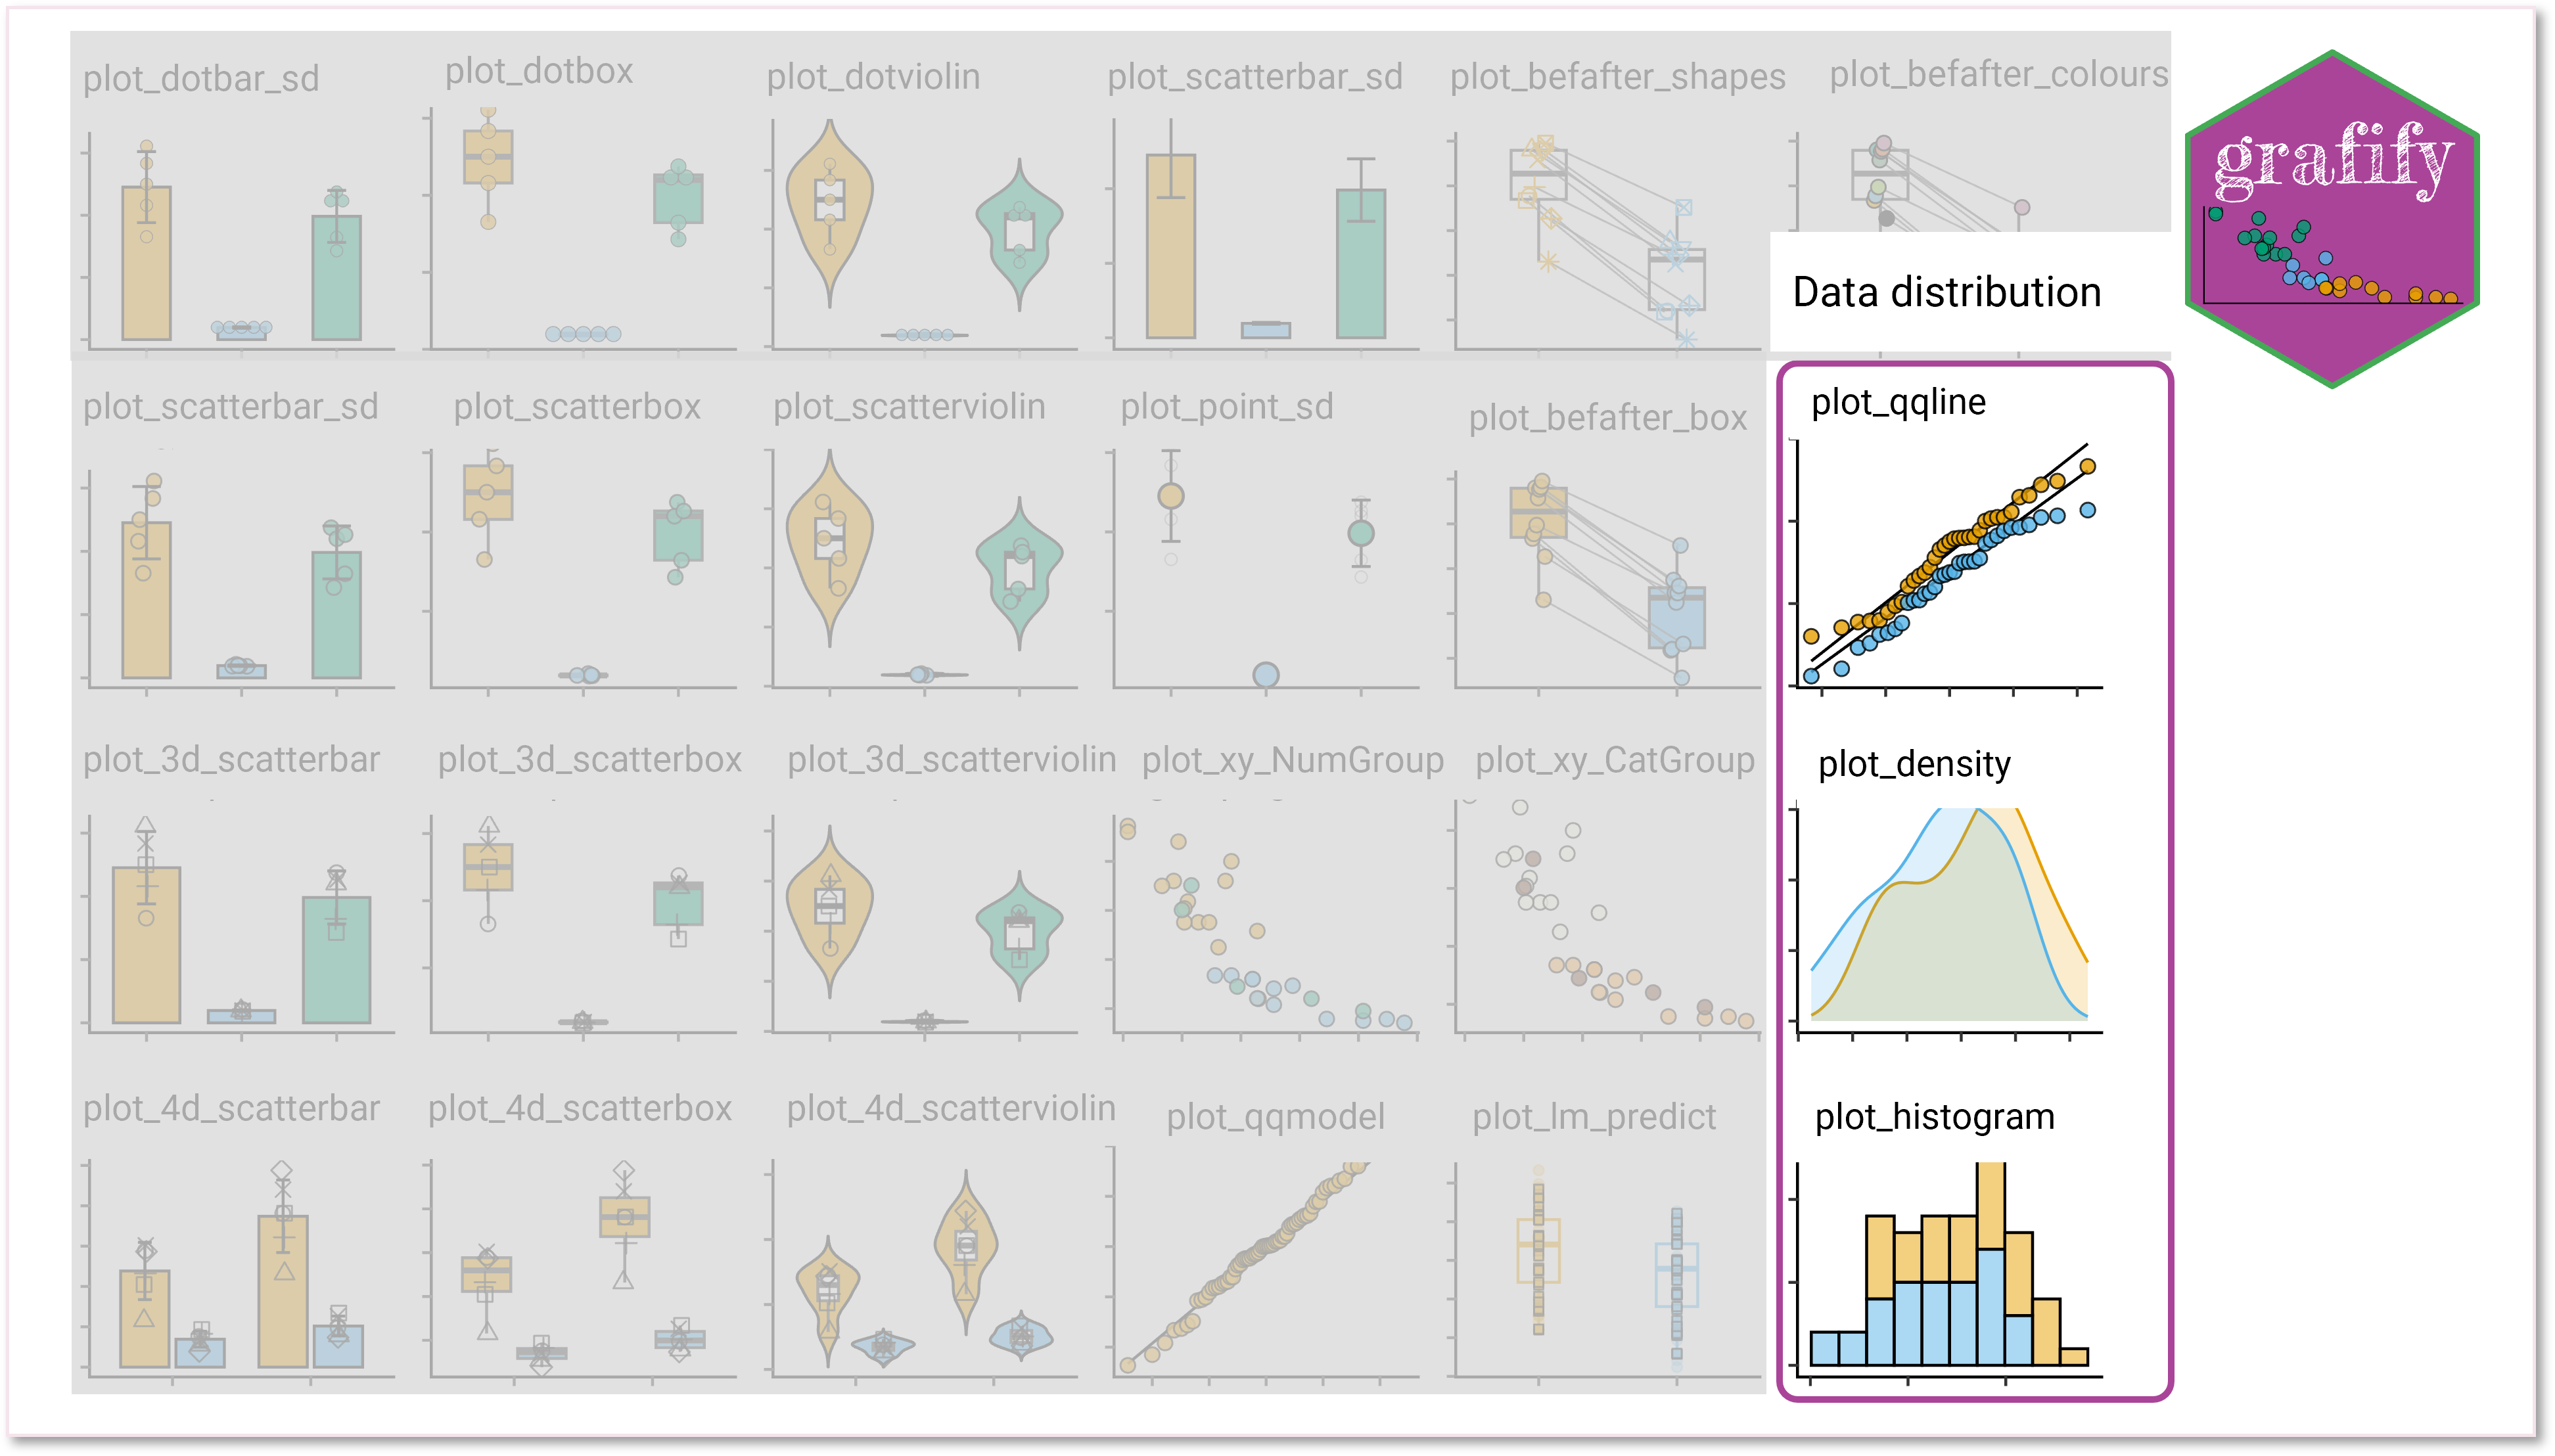
- Data distributions:
plot_qqline,plot_densityplot_histogram, andplot_qqmodel(for model residuals)
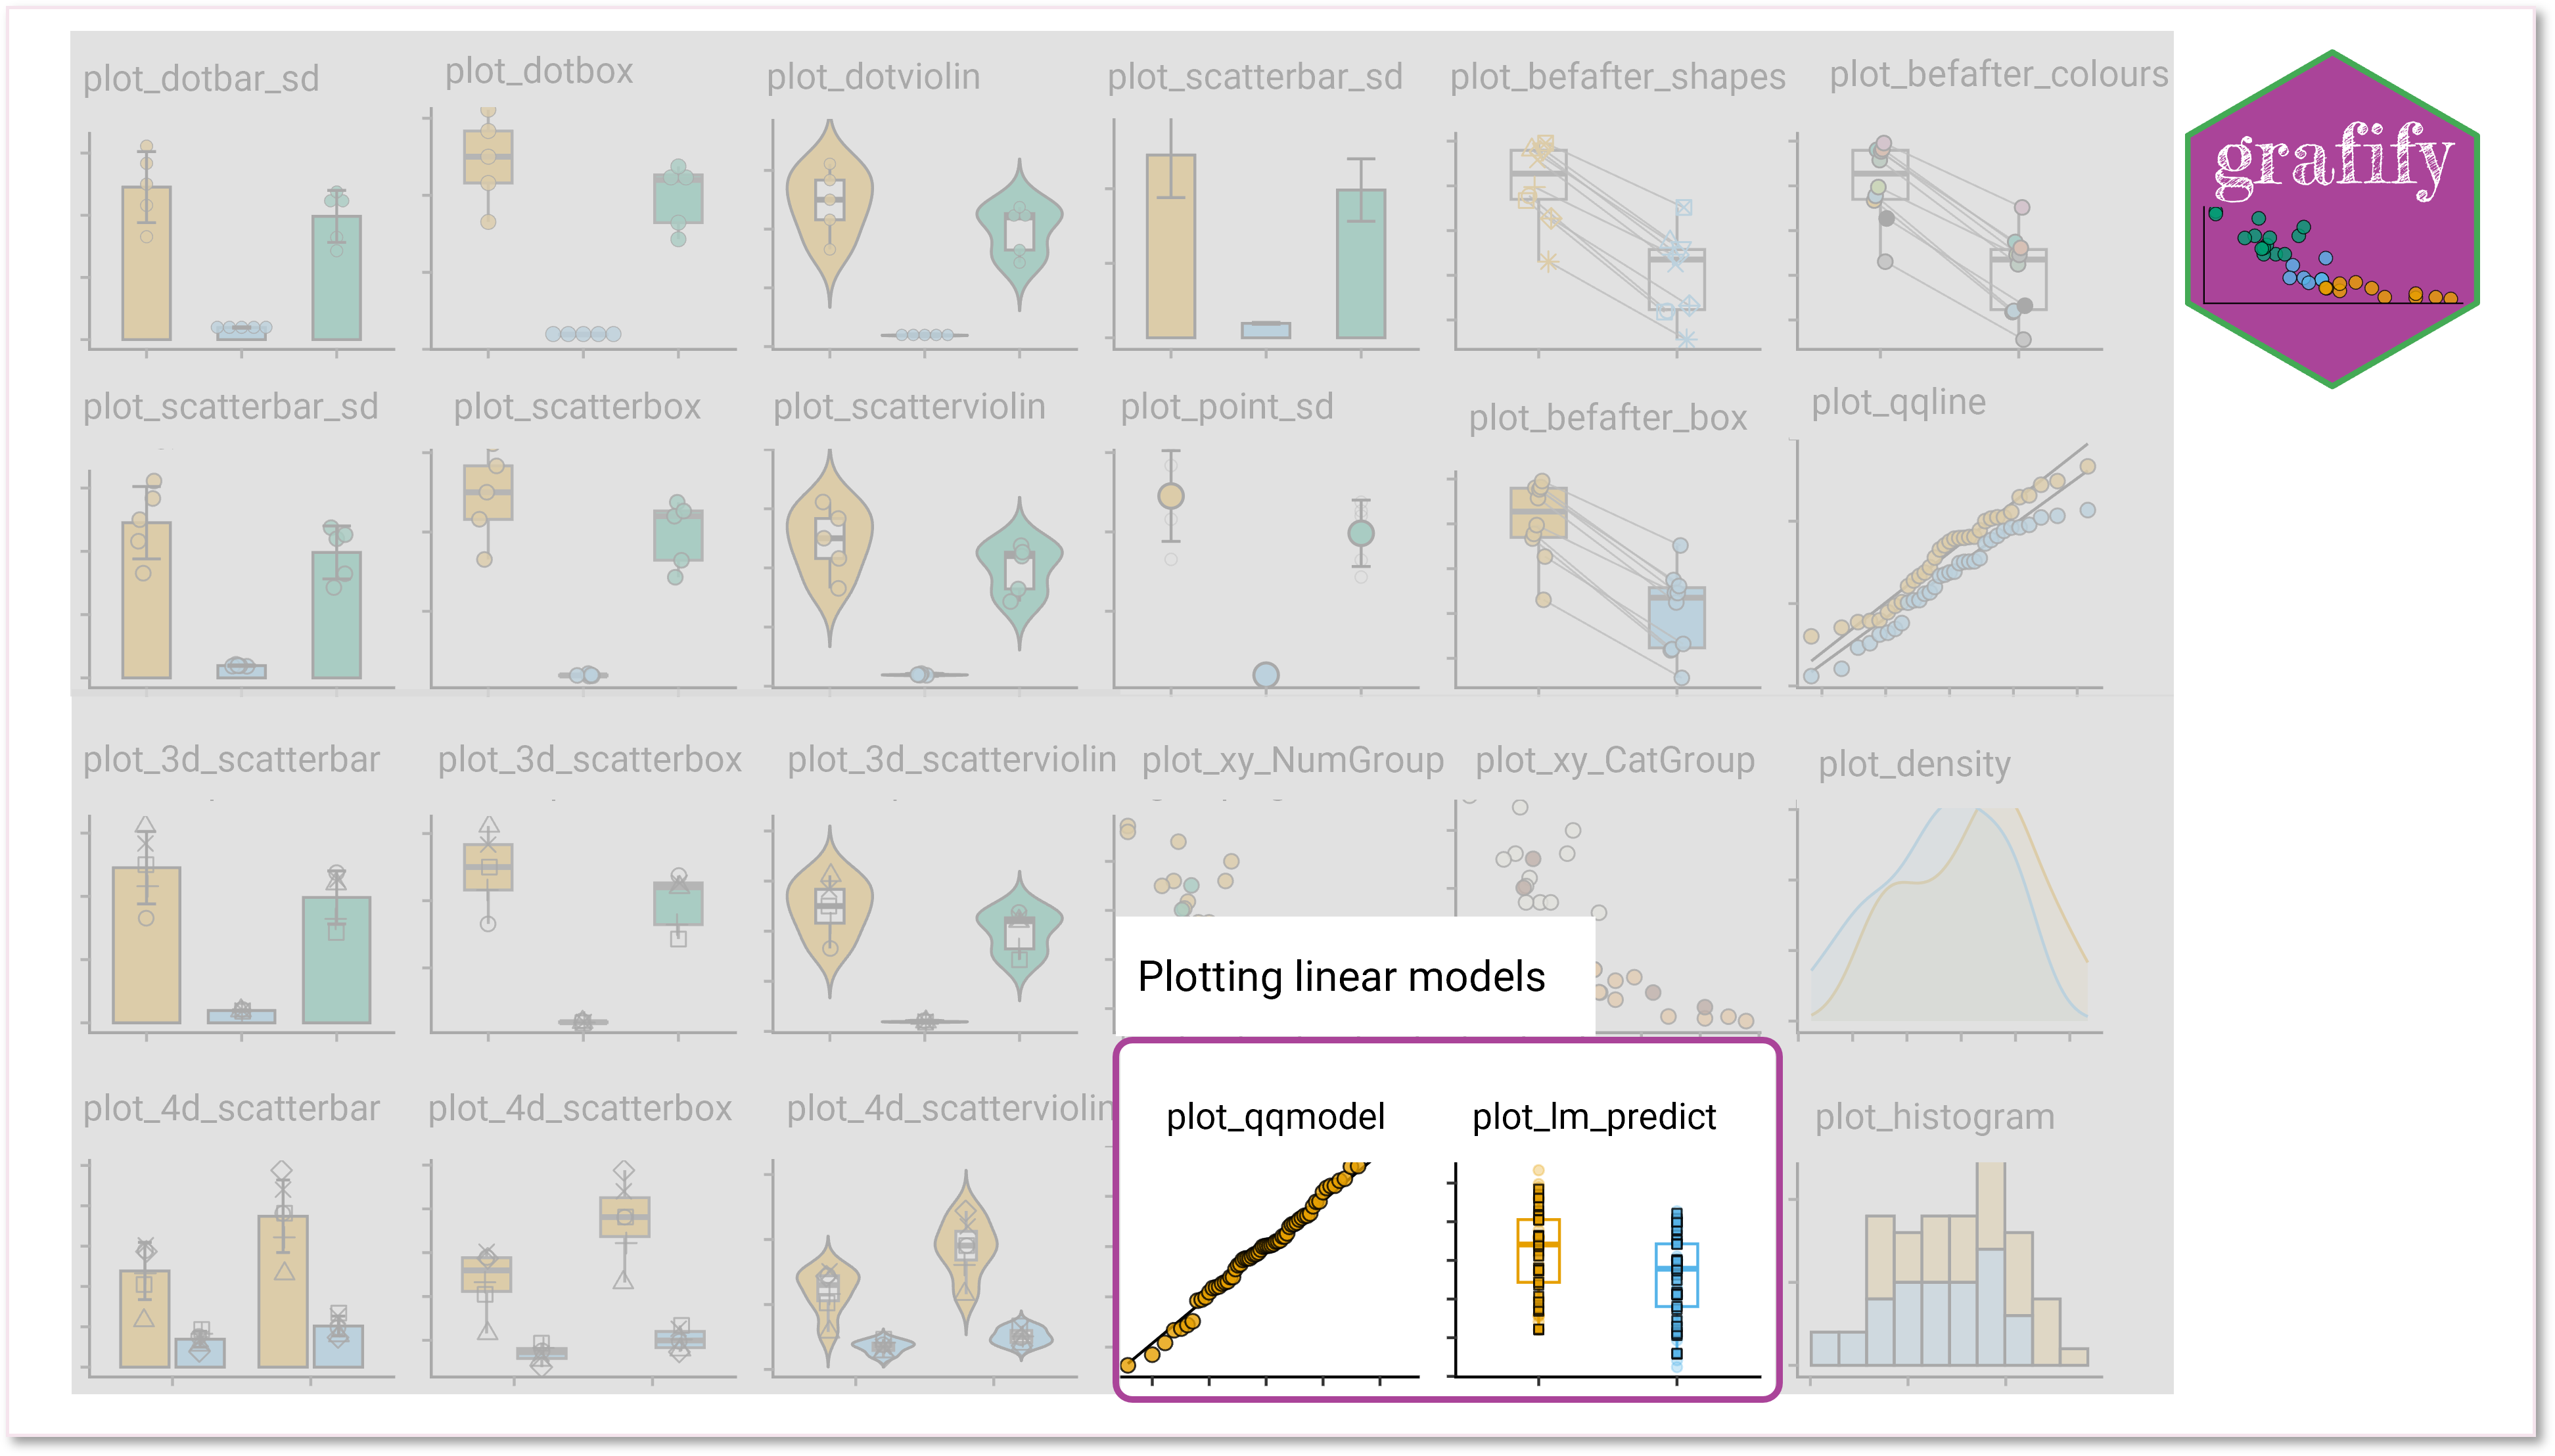
- There are also functions to plot linear models. These can be for assessing the distribution of model residuals with
plot_qqmodelor the predictions from the model withplot_lm_modelorplot_gam_predict.
Graph customisations
The following arguments can be changed (where available)
- Symbol size: adjust
symsizeordotsize - Border thickness: adjust
symthickordotthickto change thickness of symbols on the plot - Width: Bar and error bar widths, where available, can be adjusted with
bwidandewid, respectively - Font size: base font size can be changed with
fontsize - Violin plots: change trimming to data with
trim(TRUE or FALSE) and scaling withscale, which can be"area","count"or"width". - Opacity: change the
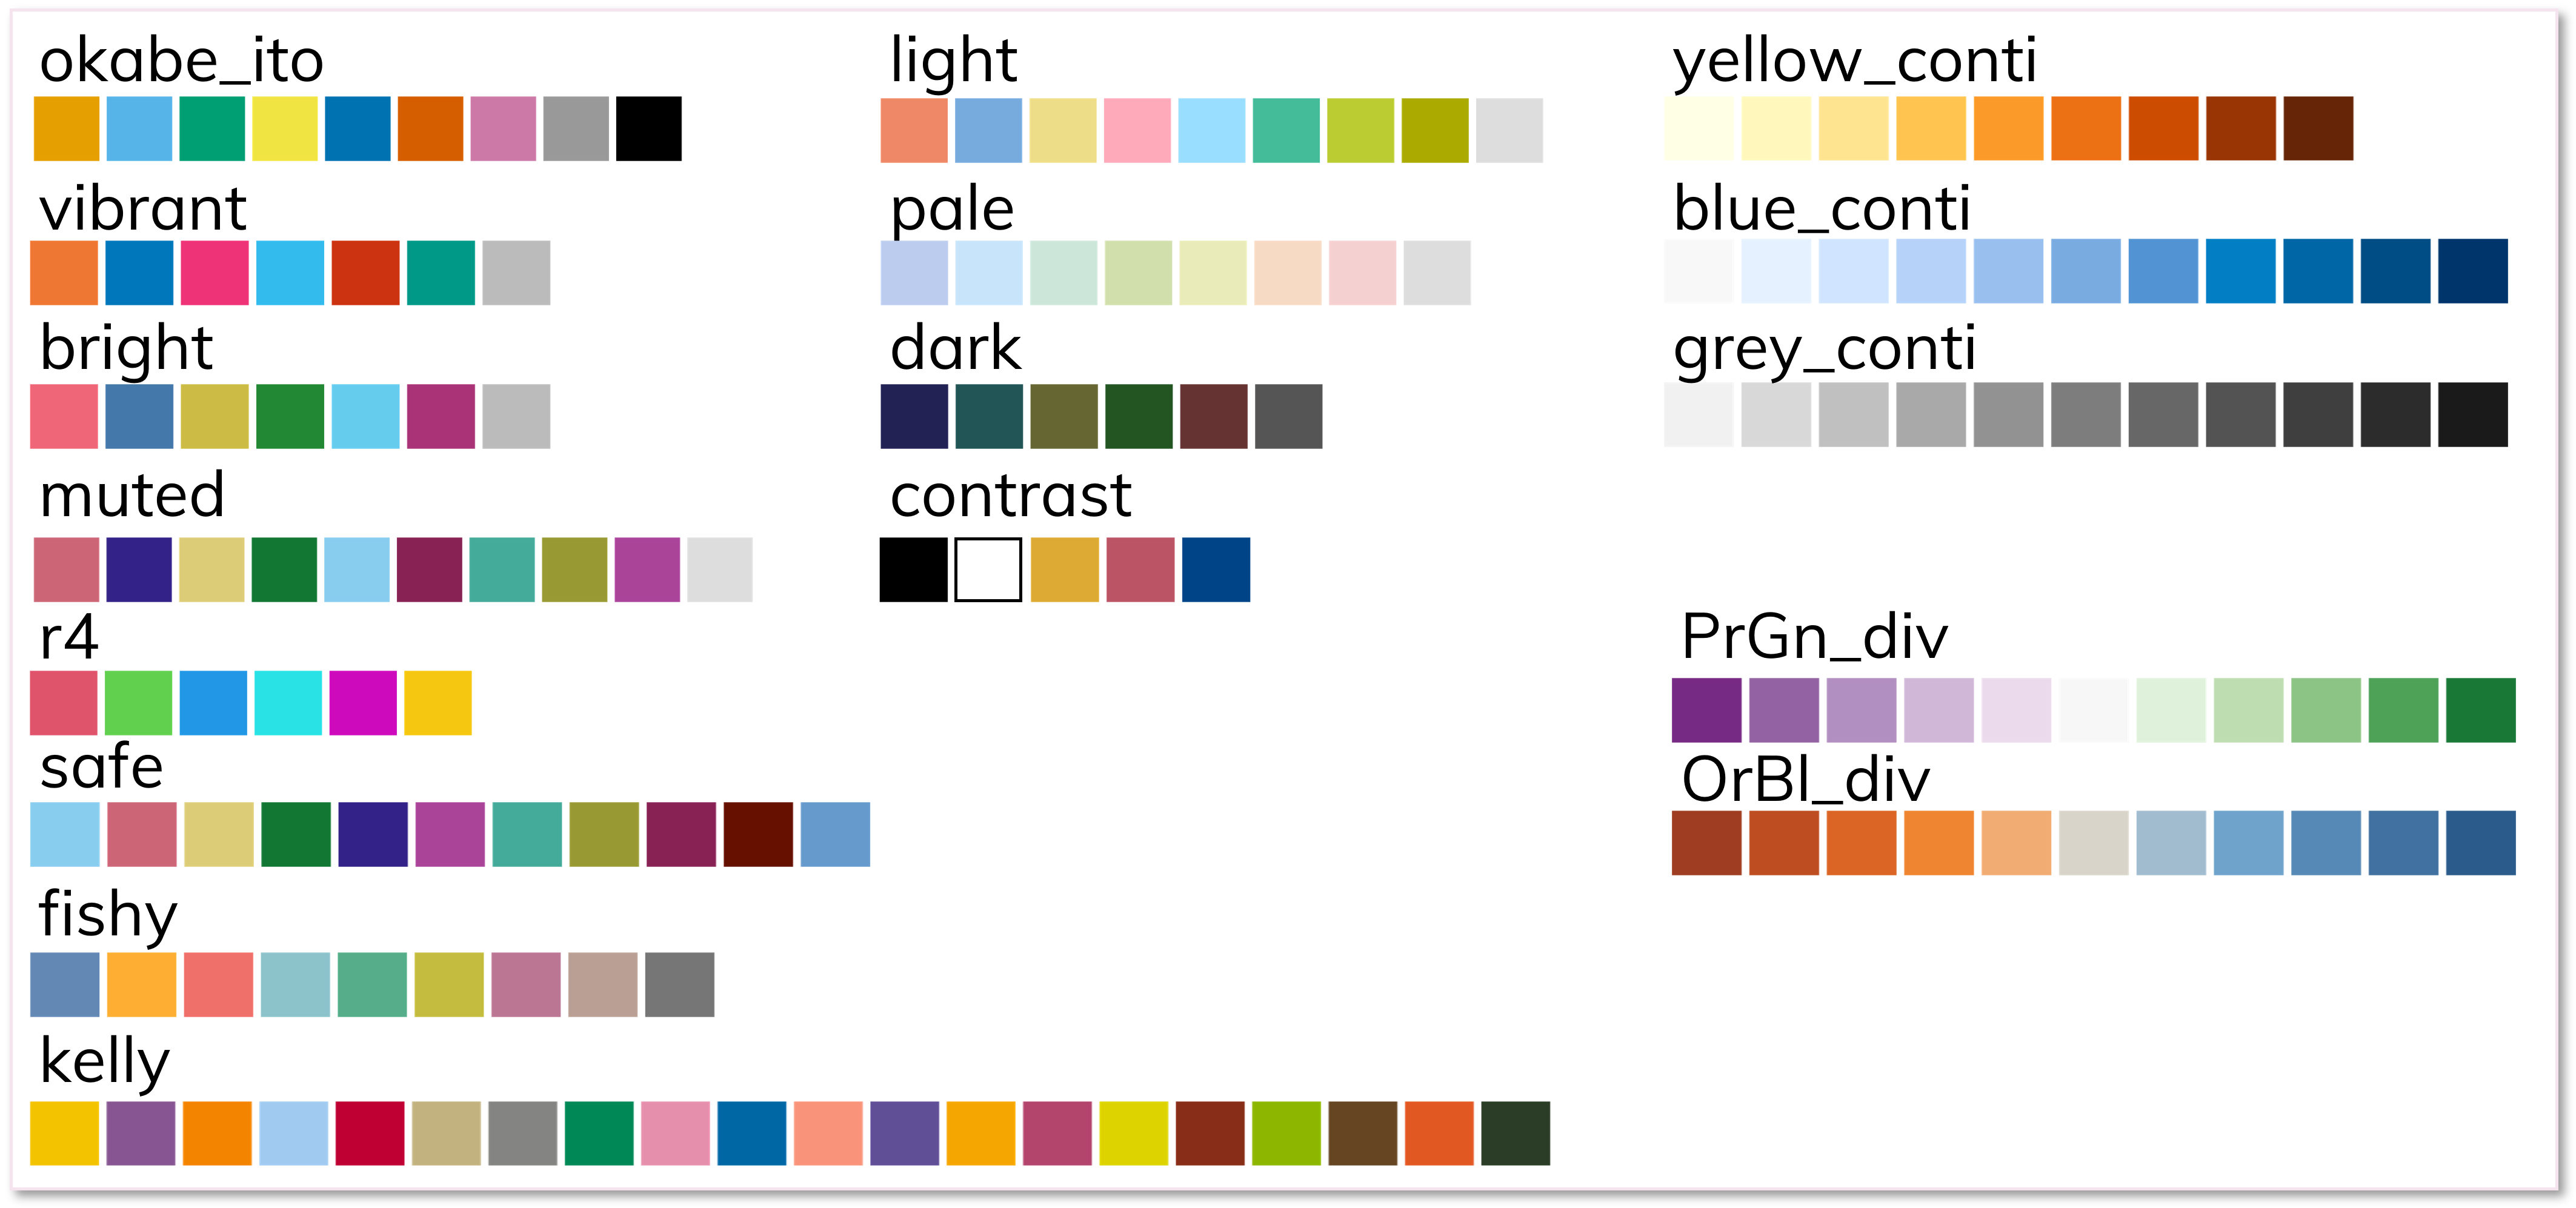
alphaparameter to increase transparency of bars or box plots (withb_alpha), violins (v_alpha), symbols (s_alpha) or dots (d_alpha); default set to 1 (i.e. opaque). Reducealphato make symbols more transparent when there are overlapping data points. - Colour palettes: set palette from one of the many using
ColPal. The choice of colours from within a given palette can be sequential or not (set usingColSeqas TRUE or FALSE). In addition, order of colours can be reversed (withColRevset to TRUE or FALSE). See colour lists in the vignette on colour palettes. - Text angle: X-axis labels can be rotated 0-90 degrees to prevent overlap of long names using
TextXAngleargument. - Jitter: random jitter or scatter of symbols can be set using the
jitterargument. When set to0there is no jitter (vertically aligned symbols; this is new in v1.4.1). - Colour choice: v2.3.0 onwards, the
SingleColourargument can be used to add a single colour to the X variable for all symbols/bars/violins/boxes. Sequential or distant colours are chosen via theColSeqargument, and colour order reversed withColRev.
Colour palettes available
All plot_... functions apply the all_grafify colour scheme by default, which can be changed to the following using the ColPal argument.
Also see the Colour Palettes vignettes to use grafify colour schemes with ggplot2 using scale_fill... and scale_colour... functions.
Additional tips
- Data should be in the long table format for all
plot_functions (andgrafifyin general). - The output of all
plot_functions is a ggplot2 object withtheme_classic()with base font size of 20. Sizes of graphs and fonts may be system-dependent, increase/decrease as necessary. plot_objects and can receive additional layers of geometries, labels, facets, colour schemes, or others, as necessary.- Graphs can be saved using
ggsavefromggplot2package (type?ggsavefor help). Also see suggestions on savinggrafifyplots here. - All functions come with documentation – use
?(e.g.?plot_dotbar). - Use
table_x_reorderto reorder categorical groups along the X-axis. - Get data summaries with
table_summary.